1-Visitor
November 3, 2016
Solved

Fourier-Analysis

  • November 3, 2016
  • 4 replies
  • 23844 views

Hello!


What's wrong with the last Fourier-Analysis of a sinus Function?


Thank you for your Help.


Volker

Best answer by Werner_E

> The wave is not fully displayed.

And if you would read my various answers her you also would know why.

You don't have to use the Heaviside function to define your signal, but doing so forces all values outside the given intervals to be zero.

In your more clear representation with the if else structure the signal is not defined outside and so you got the error, You could add a simple else at the end to set the function to zero for all other values - which would be good practice anyway.

Your signal is (now) zero for -1 < x < -3/4 but it should be part of sine in this range. Thats the reason your signal is not fully represented by the Fourier-series.

And as already written there are two ways to deal with the problem:

1) Define f.3 in a way so that it also shows the sine for values lower than -3/4

2) Don't integrate from -L to L in FC which is from -1 to 1 in case of your f.3. Use a more flexible function FC as already suggested. In case of your (or F.M.'s) f.3 you would have to integrate at least  from -3/4 to 5/4 to get the result you expect.

4 replies

23-Emerald IV
November 3, 2016

Can't see. Prime sheet lacks.

From the PDF: What is the difference between the function definitions for FC(f,N,L), FC.1(f,BN,L), FC.2(f,BN,L) andFC.3(f,BN,L)? They appear to be th same !

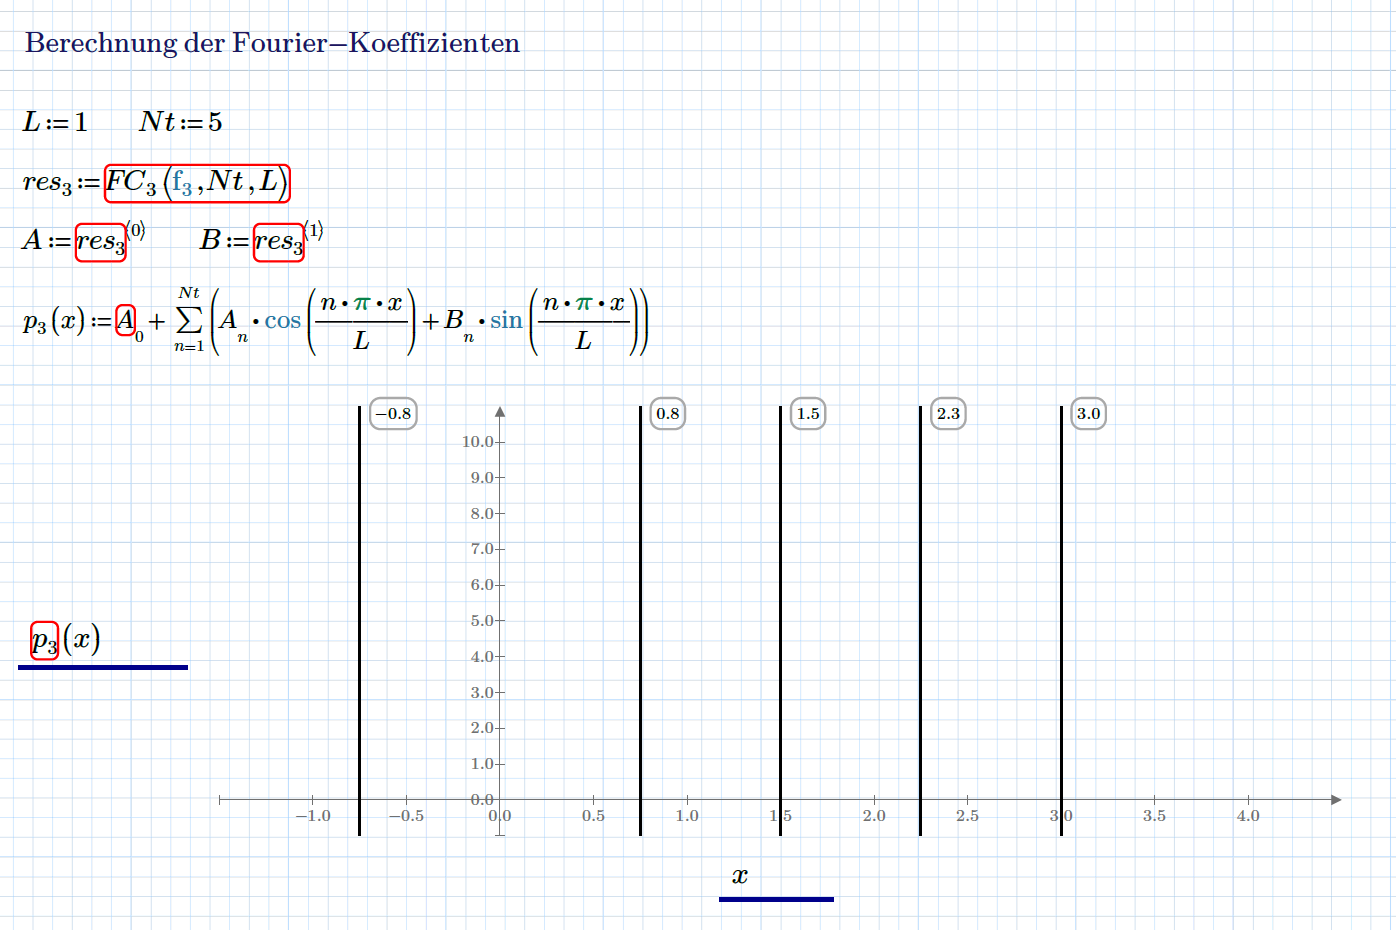
What if, instead of the offending res.3:=FC.3(f.3,Nt,L)

you call:                                       res.3:=FC(f.3,Nt,L)   ?

Luc

vlehner1-VisitorAuthor
1-Visitor
November 3, 2016

Luc,

"From the PDF: What is the difference between the function definitions for FC(f,N,L), FC.1(f,BN,L), FC.2(f,BN,L) andFC.3(f,BN,L)? They appear to be th same !"

There are 3 Functions: f, f1, f2 displayed in diagramms and converted into Fourier-functions which are also displayed in diagramms.

"

What if, instead of the offending res.3:=FC.3(f.3,Nt,L)

you call:                                      res.3:=FC(f.3,Nt,L)  ?"

I have created a seperat worksheet without the indizes "3" and the error occured again -see attached pdf.

"Can't see. Prime sheet lacks."

I hadn't sent you a mathcad-File

Thanks, Volker

25-Diamond I
November 3, 2016

You should at least have told us what exactly the error message is you get at the definition of res.3


The reason for the error seems to be that you integrate from -1 to 1, but your function f.3 is not defined in the range -1 to -3/4!

It would be more versatile if you rewrite your FC function with two arguments for the start and end of integration interval instead of providing just L. That way you are more flexible in defining the functions you wish to analyze.


Some remarks: There is no need for different functions FC.1, FC.2, FC.3. One fits all.


And in Mathcad you can write something like    if  -2 < x < 4, so you don't need to write      if  ( x>-2 )  ^  ( x < 4 ).


23-Emerald IV
November 3, 2016

"Some remarks: There is no need for different functions FC.1, FC.2, FC.3. One fits all."

That was my point in asking for any differences between them...

Luc

25-Diamond I
November 3, 2016

> That was my point in asking for any differences between them...

Yes, and I found no differences at all, thats making all but one of them obsolete. They are all the same and assume a signal f which is defined in [-L; L] which seems to be the problem as f.3 is not defined at the full range which sure would throw an error.

Therefore I suggested to rewrite FC (one fits all) so that it works with a flexible interval. In case of f.3 it would be avoidable effort to define the parabola additionally i -1 <x< -3/4.

21-Topaz II
November 3, 2016

Hi Volker

f3 is not well defined for mathcad Prime. Using the step function, everything works.

Fourier series.jpg

25-Diamond I
November 3, 2016

> Using the step function, everything works.

No, it doesn't. You set the interval -1 to -3/4 to zero that way, but there should be part of a parabola here!

So you are analyzing a different signal as was intended. There should be a parabola in the range 1 <x< 1.5 but you have just zero there! I am talking about the fourier-row here, not the signal you defined

You see the error even in your coarse approximation with five sines.

21-Topaz II
November 3, 2016

I used the f3 function defined by Volker  at the end of his pdf file, here reported below:

f3.jpg

24-Ruby IV
November 3, 2016