

1-Visitor
July 6, 2015
Solved

Graph works in Mathcad15 but not Prime 3.1?

  • July 6, 2015
  • 6 replies
  • 2046 views

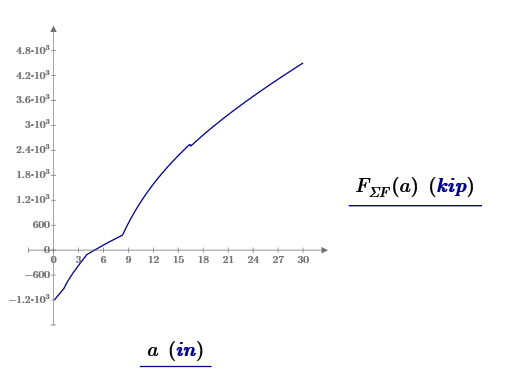
Attached is a short worksheet created in both Mathcad 15 and Prime 3.1. The graph at the end of the worksheet works in 15 but not Prime 3.1. I've attempted to make them the same but there is an error in the 3.1 program. Might folks know what is the error in the Prime 3.1 program?
Best answer by LucMeekes

You misconstructed your function Fs(a), something around the Summation operator that is wrong.

I couldn't tell what is wrong, but I got an error requiring an integer: Changed N to 2, didn't help, so maybe something with the i=1 below the summation.

I rebuilt the Fs(a) function,  and then it worked.

Success!
Luc

6 replies

23-Emerald I
July 6, 2015

I can only look at your version 15 file (I don't have 3.1.)

One possible problem  is units:  in version 15 you need to divide your plot by the units you want; you have put in commas, making your units a second plot (note the dashed blue line under kips.)  Since Mathcad recognizes both kips and in as values it will plot your function (and not plot the blue line,)  but I'm not sure what that does to Prime after translation.

dsochor1-VisitorAuthor
1-Visitor
July 6, 2015

Thanks Fred, that explains why the graphed valves in the 15 worksheet weren't as expected. That doesn't seem to help with the Prime worksheet though.

LucMeekes23-Emerald IVAnswer
23-Emerald IV
July 6, 2015

You misconstructed your function Fs(a), something around the Summation operator that is wrong.

I couldn't tell what is wrong, but I got an error requiring an integer: Changed N to 2, didn't help, so maybe something with the i=1 below the summation.

I rebuilt the Fs(a) function,  and then it worked.

Success!
Luc

23-Emerald IV
July 6, 2015

Nope, it's the 'i',  first parameter in the call to Fsi(i,a) in the summation operator that is offending. Probably it was interpreted as the imaginary i, because the error on the graph says to get rid of the imaginary data.

Success!
Luc

23-Emerald V
July 6, 2015

Daniel Sochor wrote:

Attached is a short worksheet created in both Mathcad 15 and Prime 3.1. The graph at the end of the worksheet works in 15 but not Prime 3.1. I've attempted to make them the same but there is an error in the 3.1 program. Might folks know what is the error in the Prime 3.1 program?

Looks as if there may be a bug in Prime 3.1, or perhaps a misinterpretation on my part of how the summation operator works in Prime.  The problem arises in this expression (copied from the M15 version as I can just select, copy and paste ... just as I want):

Earlier in your worksheet, you've got i defined as a range variable (i=[1 2]).  It appears as if Fs is passing the range variable to Fsi rather than the value that the summation iterator value.   Changing i in the summation to k makes a graph appear.

Stuart

dsochor1-VisitorAuthor
1-Visitor
July 6, 2015

Thank you all very much, I retyped the Fs(a) function and it works. It looks exactly the same as previously but now it functions!