13-Aquamarine
March 2, 2016
Solved

Graphing/vectors with 'if' statements

  • March 2, 2016
  • 7 replies
  • 2726 views

Just trying to familiarise myself with MathCAD, and start the process of converting from Excel...

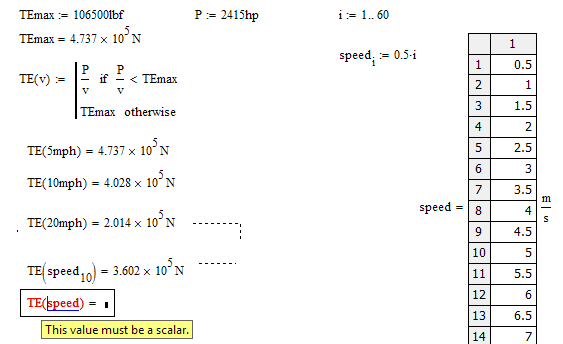
As a practice problem, I'm trying to graph a functions which involves an 'if' statement: tractive effort (force) determined either by a maximum (limiting) value, or by dividing the available power by speed, whichever gives the lower value.

In Excel I'd use a 'min()' function at each point, but this isn't going to work in MathCAD because it will look at the whole of my speed vector (for plotting) and find the single minimum value.  Therefore I'm using an 'if - otherwise' statement to define my function for tractive effort.  This works for any individual speed value, including a single index of my speed vector, but won't accept the full vector to generate a graph.

At least the units seem to be behaving themselves!
TEvsSpeed.png

How should I be approaching this?

Best answer by ValeryOchkov

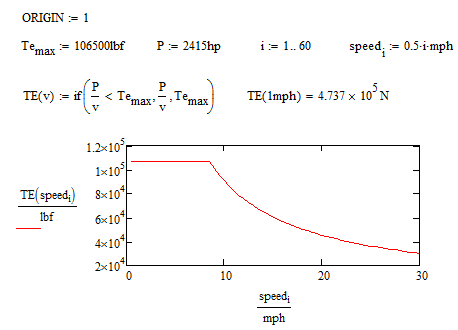
Or with a plot

7 replies

24-Ruby IV
March 2, 2016

Or with a plot

25-Diamond I
March 2, 2016

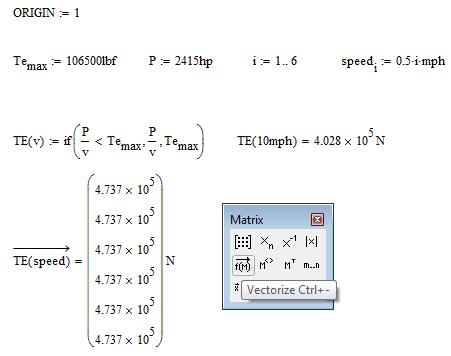
You have to use vecorization when you call TE(speed). EDIT: As Valery just showed while I was typing 😉

The vectorize operator is on the matrix palette. You should get TE(vectorize) with an arrow over it.

That way every single value is fed in your function and the results are collected in a vector.

The way you did it you fed TE with a vector, So in your function TE the argument v is a vector, and so P/v is a vector, too (Mathcad uses automatic vectorization here). You can't compare a vector with a constant TEmax and so you get the error.

BTW, you don't need any ranges, vectors etc. if you simply want to plot the function - don't think Excel, welcome to Mathcad!

It would have been a good idea to attach your worksheet.

WE

13-Aquamarine
March 2, 2016

Thanks Werner and Valery!  It was the implicit / automatic vectorization in some cases that caught me out - it worked for other cases (such as aerodynamic drag) but not this one.

From Valery's screenshot I've noticed the alternative approach, to vectorize the result using my range variable i as a subscript - I can see that both methods work, both for displaying a result vector and for defining the graph.

Werner Exinger wrote:

BTW, you don't need any ranges, vectors etc. if you simply want to plot the function - don't think Excel, welcome to Mathcad!

Unless I'm missing something, that only works if I want the function plotted between -10 and +10 - how do I change the graph range without using range variables or vectors?

Updated worksheet attached, although I realise that at least the three of you have recreated it already.  It doesn't really go anywhere as I'm just using this to practice using MathCAD.

23-Emerald V
March 2, 2016

Jonathan Hodgson wrote:

Unless I'm missing something, that only works if I want the function plotted between -10 and +10 - how do I change the graph range without using range variables or vectors?

Click on the x axis.   You should see the default values of -10 and 10.  Just type over the values with the range that you want.

-10 to 10 (default)

replaced with 0 to 90

You can also do the same thing with the y axis (if needed)

Stuart

23-Emerald V
March 2, 2016

An alternative approach is to generalize the upper threshold function (if you feel you might use it again), and use a local function inside it to deal with the vectorization.  You can just use it with a vector or scalar as you see fit.

Stuart

13-Aquamarine
March 2, 2016

Thanks Stuart - I'm going to have to think about that some more...