
1-Visitor
September 13, 2017
Solved

Having trouble graphing my functions

I attached the file that I am having issues with. I am trying to plot three of my functions onto a single graph but right now they arent working. I think there is a problem with the input variable that I am using. I also don't know how to get three functions to plot on one graph. I've also attached a pdf with an example problem that shows roughly how the graph should look along with the funcitons used. My circuit is different which is why some of the functions may look different. 
LucMeekesAnswer
23-Emerald V
September 13, 2017

Your i is defined as a range (from 0 to N-1) but never used. That's no problem.

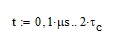
Your t (the variable you want your voltages and currenty to plot against), is NOT defined. That's a problem.


Add a

LM_20170914.png

Just above the plot, and it should work.


Success!
Luc


3 replies

21-Topaz II
September 13, 2017

Snarra2015.jpg

Translate
1-Visitor
September 13, 2017

This is pretty close to correct. Vo is also supposed to be plotted on the first graph. Could you possibly attach your mathcad file so that I can see what to change in the future.

Translate
LucMeekes23-Emerald VAnswer
23-Emerald V
September 13, 2017

Your i is defined as a range (from 0 to N-1) but never used. That's no problem.

Your t (the variable you want your voltages and currenty to plot against), is NOT defined. That's a problem.


Add a

LM_20170914.png

Just above the plot, and it should work.


Success!
Luc


Translate