

Question
Help with "complicated" Interpolation
Hello everyone,
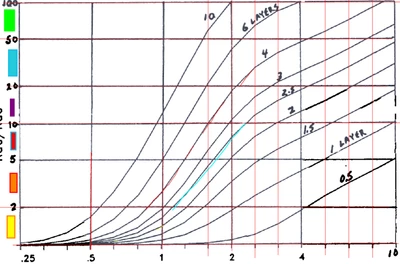
I need help please to derive the following function:
This function shows different curves (0,5 Layer ... 10 Layer).
The X- and Y- axis are not linear. I divided both axis into 5 sections. For each curve I have take some data points for each section.
I am seeking this final graph:
The datapoints for the different curves are attached.
How can I recreate these datapoints as a function, like in the graph shown above?
For each section I have to interpolate with spline functions?
Then I do need a "if... if else ... else" command to check which section is active?
Attention, the Sheet is Mathcad Prime 6
Kind regards