
4-Participant
July 30, 2026
Question

Help with plotting multiple circles on an x,y plot using an index

  • July 30, 2026
  • 2 replies
  • 22 views

Hi

I have a parabola and *n* circles that need to be plotted simultaneously.The idea is that the value of *n* can be changed, and the plot updates automatically without me having to manually add plots.I have managed to plot the circles individually as upper and lower segments—this works fine, provided I can set up the indexing so that it plots all of them automatically.Additionally, I would like to plot the tangent slopes at the intersection points of the parabola and the circles—I have already calculated these—is this possible?
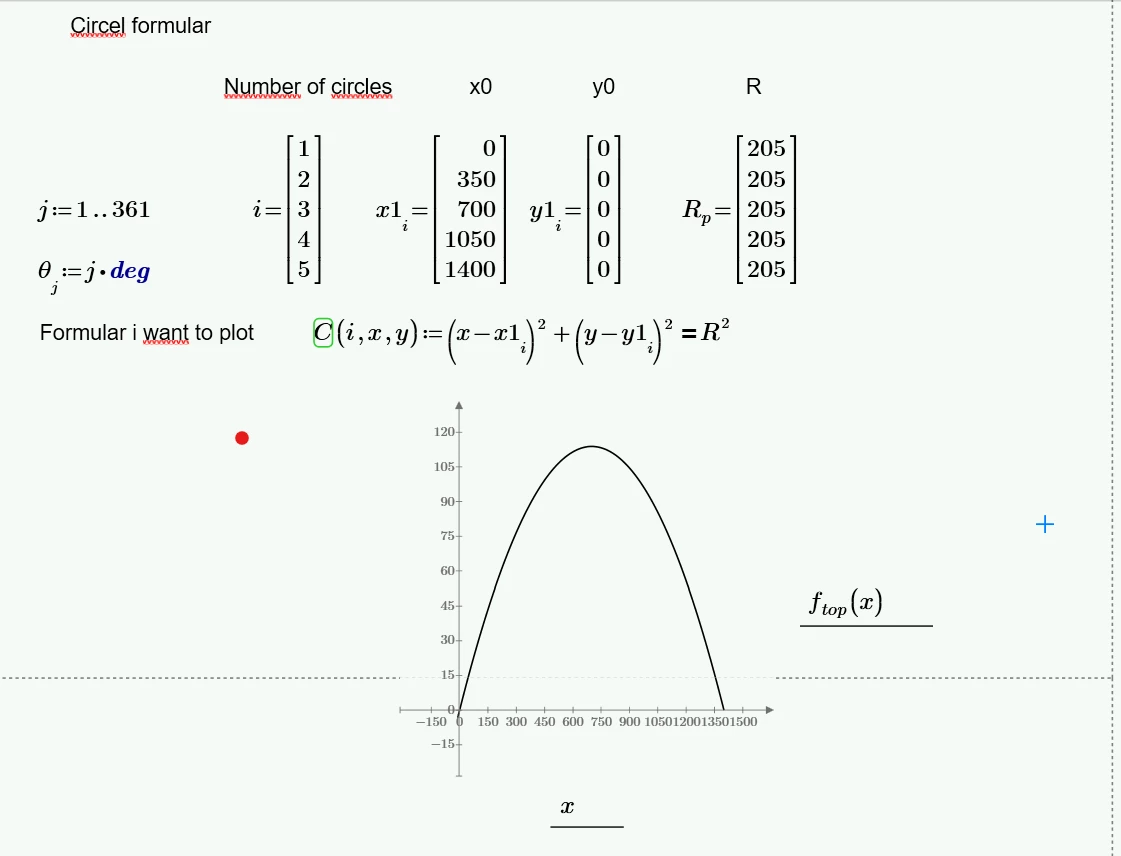
 

My current go to- where i need to ajust number og circles as the number of piles change:
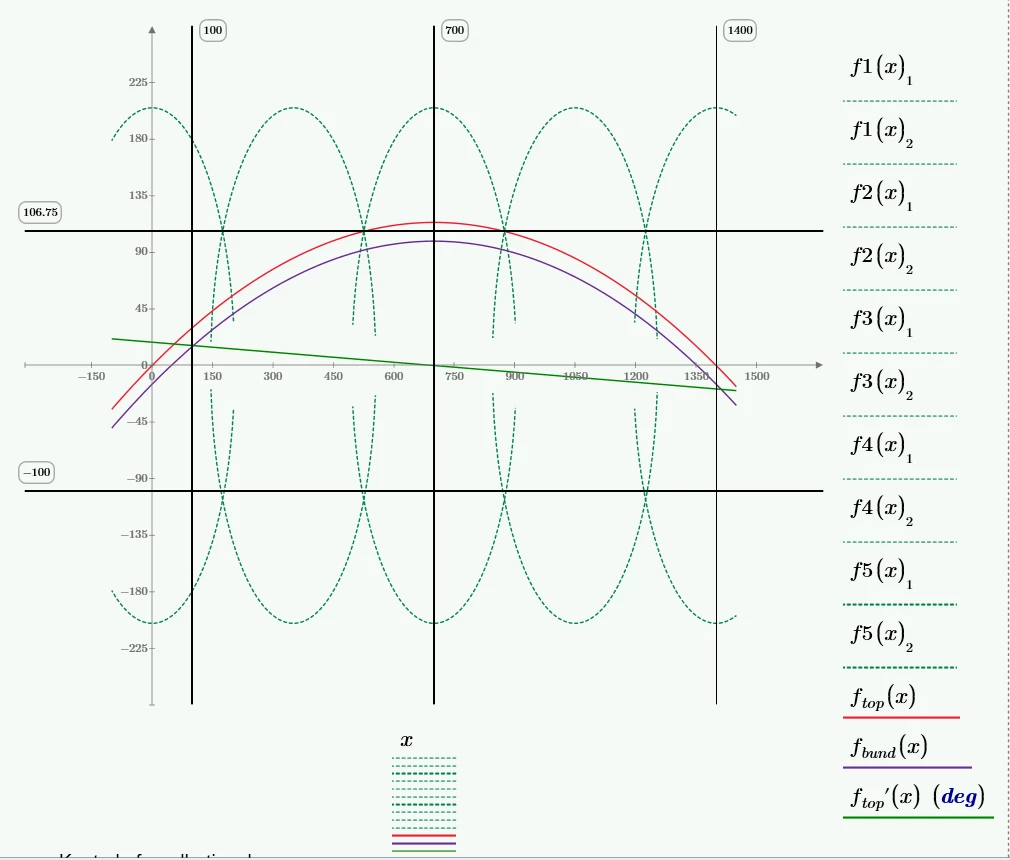
 

Hope someone can help
Best regreads
2 replies

25-Diamond I
July 30, 2026

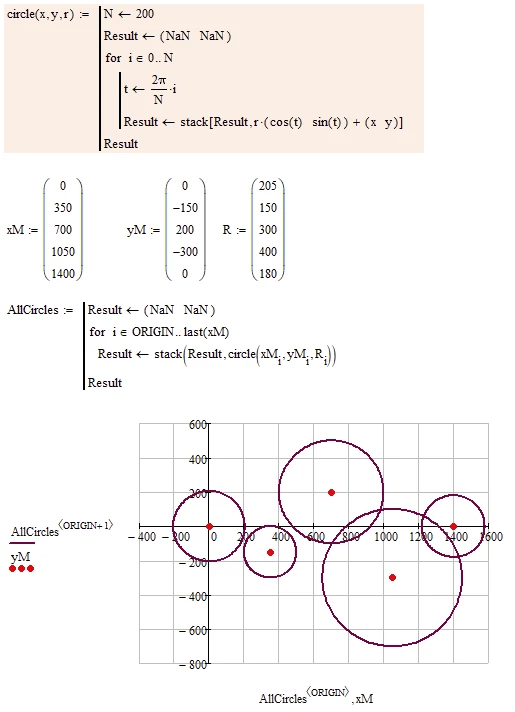
Here is one possible way, done in Mathcad 15.

I attach the file so if you have the converter installed you may convert it to Prime format.

The function “circle” creates a  n x 2 matrix representing a full circle made up of N points (you can change N in the program or make it an additional function argument if you like).

Multiple of these matrices can be stacked and NaN’s are used to separate the various plots, so you don’t get a line from the last point of one circle to the first one of the next.

“AllCircles” is just that - it runs through the vectors of center coordinates and radius and stacks the the data structure of the various circles one on top of the other. 

So all circles can be plotted in one go by plotting the second column of this matrix “AllCircles” over its first column.

All circles share the same color, line width, line style… - its just one single trace.


4-Participant
July 30, 2026

Hi Werner


That did the job: