7-Bedrock
January 24, 2012
Solved

High-resolution plots in Mathcad

  • January 24, 2012
  • 3 replies
  • 15125 views

Dear friends,
Maybe, anybody can suggest me, how to export high-resolution plots from Matcad, say in vector formats as EPS or similar?

Best answer by k_nosov

Thank you, Richard. It seems, your solution works properly. I also have AI CS5 (rel. 15.0.2) and the Copy&Paste operation inserts plots in AI in high vector quality. Only labels sometimes distort (see fig.).

Snap1.jpg

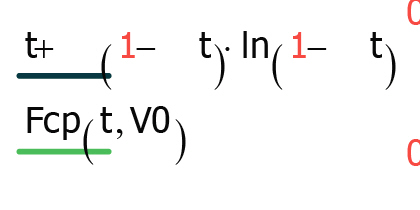
So Mathcad -> buffer -> AI is an appropriate solution.

3 replies

24-Ruby III
January 25, 2012

You can save Mathcad worksheet in a format ".html", thus it is possible to select the extension and quality for pictures as ".png" and ".jpeg" (then these files can be found in a folder "_images").

Also look at the topic "Mathcad Figures in Other Documents", which was discussed earlier: http://communities.ptc.com/message/164019

k_nosov7-BedrockAuthor
7-Bedrock
January 25, 2012

Thank you, Vladimir. Sure, I am familiar with the HTML export of worsheets. Unfortunatly, resolution of saved plots aren't enough. Sometimes journals require illustrations with resolution 300 or even 600 DPI. When I asked a question, I meant, that, maybe there exist some extentions of Mathcad allowing to obtain high-resolution illustrations in vector formats as EPS or AI. Now I see, that unlikely.

24-Ruby III
January 25, 2012

But you can try to convert images to vector format (by using this tool, for example: http://vectormagic.com/home).

1-Visitor
February 19, 2013

Since the university graded up to office 2010 I got problems with importing graphs from MathCad (14). My procedure was: copy into powerpoint 2003 and when needed ungroup. However 2010 creates a link to mathcad or a low resolution bitmap.

After reading this discussion and trying several possibilities maybe I found a workaround solution which means a lot more work anyway:

copy graph into word 2010 (use an empty document). Now it is possible to ungroup to a MO drawing object (as in powerpoint 2003). Select all (^A) and group. Copy the group to powerpoint 2010. Lock aspect ratio if you want to resize. After resizing font size can easily be adapted (is not resized). Formula distortion as in your example will occur. (e.g. × apparently is not available in the font (Tahoma) I used; since I do not like the layout of MC arguments I hide the arguments (in Traces)). In powerpoint one can now edit the graph (add arguments) and make a new group. Copy back to word 2010. When you copy into a text box it is even possible to scale the graph including the text!

Hope this will work for some of you...

12-Amethyst
February 20, 2013

I'm late to the party once again. It looks like Richard has you on the right track with Adobe. I have one other suggestion: write the whole paper in Mathcad and then print to a file in pdf format. You can use CutePDF Writer or PDFCreator or any other free software of that nature. That way you don't really have to export anything, you just convert it all. The printout from that file can go up to 1200 dpi on my system.

If you really have to export a graph by itself and you want to resize it, you can copy it from Mathcad, paste special> Enhanced metafile into a blank Mathcad worksheet, resize, then print to pdf as above. This method won't allow you to change heading fonts after the export, but the entire plot and headings scale in proportion.