
1-Visitor
December 8, 2014
Question

How can I graph in this situation?
  • December 8, 2014
  • 6 replies
  • 1895 views

29.PNG

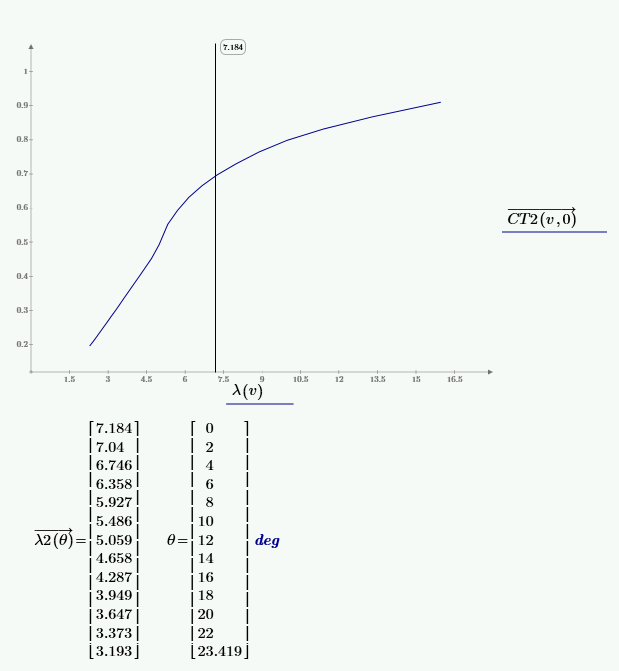
you can see a line in this picture.

I need to change data on the left side in a line.

this data is under a graph. lamda is changed depending on "theta"

it means that graph on the left side in a line will be changed because other data are applied.

I tried to apply it several times, but I failed contunally.. could you help me?
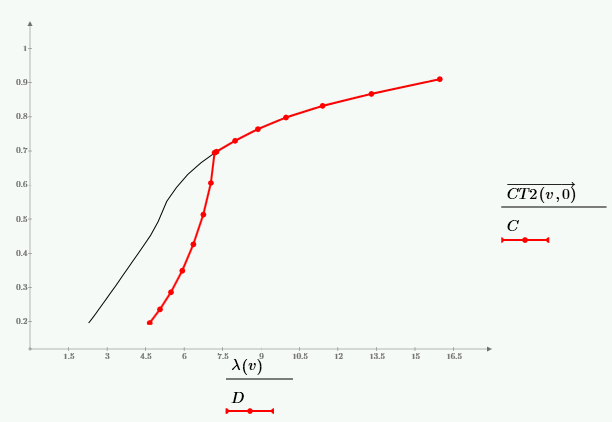
30.PNG

I want to graph automatically such as upper a picture.

This is picture that I graph manually.

6 replies

Werner_E
25-Diamond I
December 8, 2014

I don't see any theta in the graph or in functions and arguments involved.

The argument of lamda seems to be some kind of velocity, the argument of lamda2 is an angle.

jlee-21-VisitorAuthor
1-Visitor
December 8, 2014

my graph indicate theta in CT2(v,0). 0 is theta.

"v" and "theta" are functions about CT2. I just expressed CT(v,0) becasue I want to graph a curve in case of CT(v,0)

the argument of lamda2 is an angle>>>you said

the argument of lamda2 is "theta"

I attached my file

Werner_E
25-Diamond I
December 8, 2014

This does not help determining what you are trying to do.

If you want lamda to change when theta changes, you have to make lambda dependent on theta, so lambda would be a function lambda(v, theta).