

1-Visitor
August 3, 2012
Solved

How do I plot two fitted surfaces in one frame?

  • August 3, 2012
  • 4 replies
  • 2531 views

Hello everyone. I got some data (x=εs y=Uslip z=dcl or φ), and plotted them in a 3D scatter plot, see below
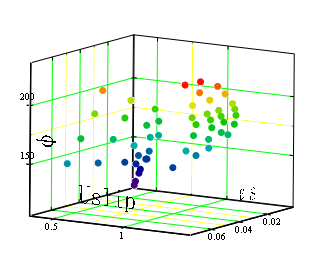
001.PNG

and x-z, y-z, x-y plots are also given as
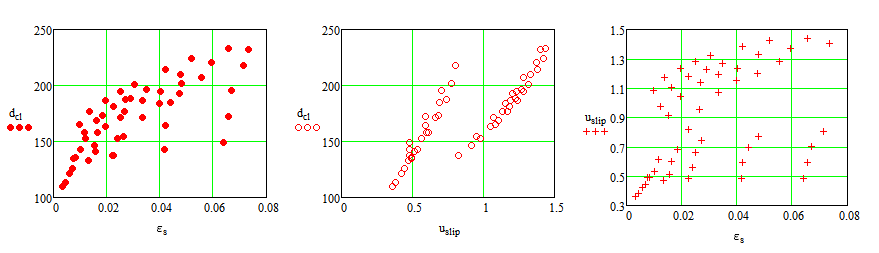
002.PNG

according to dcl-uslip , it seems that the data can be classified into 2 groups, so I wanna fit 2 surfaces in one plot, but I dont know how to do this.

can anybody give me some help?

thx

Best answer by RichardJ

Your data is defined as x, y, and z vectors, so you only need a vector of residuals, not a matrix.

4 replies

19-Tanzanite
August 3, 2012

Something like the attached? There are ways to automatically separate data into groups (look up "cluster analysis") but this case was so easy I just defined a line by eye.

FanCG1-VisitorAuthor
1-Visitor
August 3, 2012

Thank you very much! Richard

your suggestion works finely to my other data sets

and after splitting the data I did some regressions to the raw data sets using the procedure recommonded by mathcad (see following), and extracted the coefficients

001.PNG

002.PNG

and when I tried fitting the data by a user-defined objective function with minerr function , dimension matchness problems and strange results were always encountered

does anybody know how do I avoid the problem? or is it correct that I use minerr function in such a case?

RichardJ19-TanzaniteAnswer
19-Tanzanite
August 3, 2012

Your data is defined as x, y, and z vectors, so you only need a vector of residuals, not a matrix.