
1-Visitor
November 6, 2022
Solved

how possible to build two or more curves at one graph (plot) - MathCAD
  • November 6, 2022
  • 2 replies
  • 2031 views

Screenshot_111.png


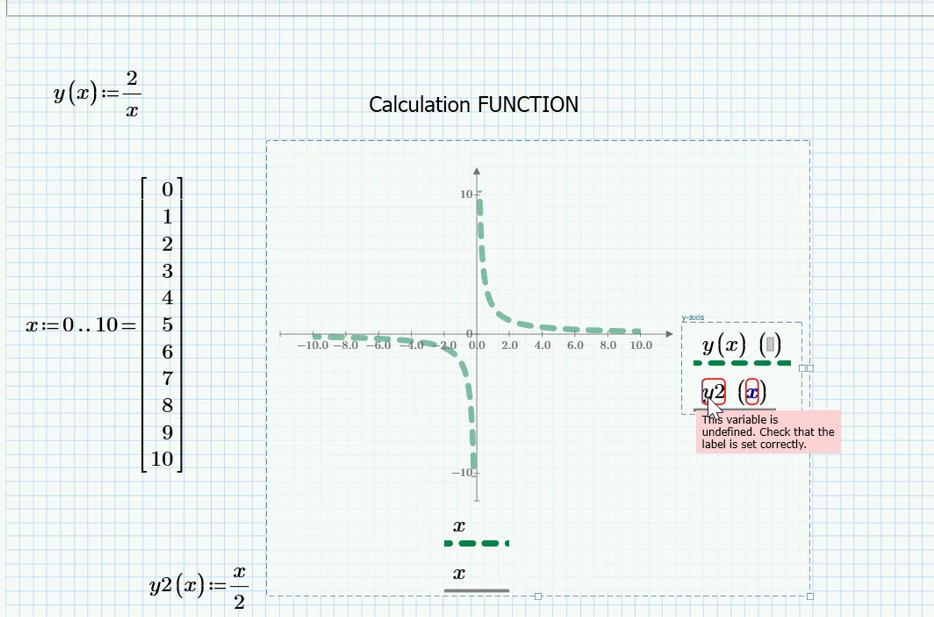
Could someone explain, please, how possible to build two or more curves at one graph (plot) in MathCAD Prime? "This variable is undefined. Check that the label is set correctly." the error message is shown.

Best answer by terryhendicott

Hi,

In the graph the second parameter of the y axis needs to match the definition of the first y(x) with o space between the y and the brackets no units ()

You have y2 then a space (x) in the units you need to change this also.

Cheers

Terry

2 replies

21-Topaz II
November 6, 2022

Hi,

Prime works from left to right , top to bottom.

The definition of y2 is below the graph so the graph does not know it.

Solution is to move definition of y2 above the graph or move the graph down below the definition of y2

Cheers

Terry

21-Topaz II
November 6, 2022

Hi,

In the graph the second parameter of the y axis needs to match the definition of the first y(x) with o space between the y and the brackets no units ()

You have y2 then a space (x) in the units you need to change this also.

Cheers

Terry

25-Diamond I
November 6, 2022

Additionally to what Terry already wrote you made another mistake. The parentheses, in which you have written the variable x after f2, are for possible units. Where f2 stands you have to type f2(x) and leave the following parenthesis empty.


BTW, typing an evaluation "=" immedeatly after defining the range x turns the range variable into a vector, Thats an undocumented trick but I guess you did not do it on purpose and you should avoid doing so as it can have unexpected effects.

Try to plot f3(x)=x * x and compare it with the plot of f(x):= x^2   🙂