
8-Gravel
Feb 16, 2023 3:03 AM UTC
Solved

How to define xy axis in 3D plot drawing by matrix

Hi all

Please, see the attchd.file.

There is a graph where I would like to represent parameters x and y related to z.

I have no idea how to define the x and y axis.

Does anybody have an idea how to do that? Thx


terryhendicott
21-Topaz II
Feb 16, 2023 3:39 AM UTC

Hi,

Yes it is necessary to establish a nested vector of the x, y, and z coordinates like this
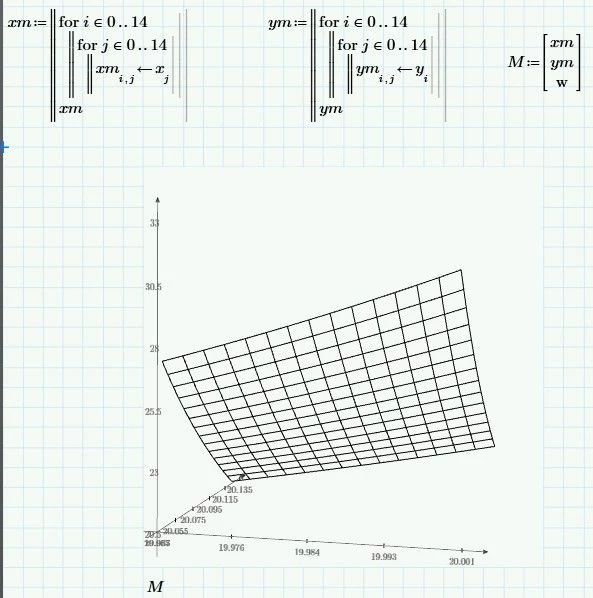
Capture.JPG

5 replies

terryhendicott
21-Topaz II
Feb 16, 2023 3:39 AM UTC

Hi,

Yes it is necessary to establish a nested vector of the x, y, and z coordinates like this

Capture.JPG

Translate
terryhendicott
21-Topaz II
Feb 16, 2023 3:58 AM UTC

Hi,

A contour plot is the best way to visualize the resulting nested M matrix

Capture.JPG

Cheers

Terry

Translate
24-Ruby IV
Feb 16, 2023 5:00 AM UTC

I use paint

See Egg of Columbus - Wikipedia

ValeryOchkov_0-1676523535069.png


Translate
Aary8-GravelAuthor
8-Gravel
Feb 16, 2023 5:55 AM UTC

HI ValeryOchkov

could you share the .mcdx file ,thx

Translate
Werner_E
25-Diamond I
Feb 16, 2023 5:02 AM UTC

How about creating an interpolation function? See attached sheet.

As your data matrix is square its not clear if x would relate to the columns or to the rows.

In the attached sheet I assume that x would relate to the rows, and y to the columns.

If it should be the other way round (as Terry assumed), you simply have to exchange X and Y when calling linterp_2D().


Translate