
Best answer by Werner_E

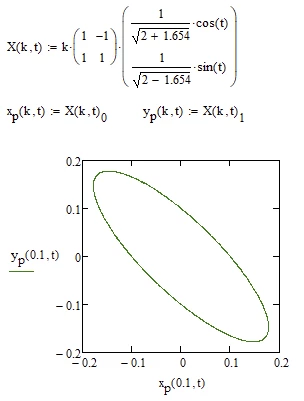
For whatever its worth - here is a parametric representation of your ellipse which makes plotting nicer an easier:

Werner_E_0-1588510327242.png


2 replies

21-Topaz II
May 3, 2020

Hi,

You need to put x as a parameter of y to get a plot.

Capture.JPG

25-Diamond I
May 3, 2020

Here are some thoughts on the problem.
Its not clear to me for which value of k you tried to plot the ellipse. k=0.1? But then what about the "2"?

Werner_E_0-1588506820610.png

MC15 worksheet attached

Werner_E25-Diamond IAnswer
25-Diamond I
May 3, 2020

For whatever its worth - here is a parametric representation of your ellipse which makes plotting nicer an easier:

Werner_E_0-1588510327242.png