
4-Participant
September 15, 2017
Solved

I want to know 'How to combine two 3D plots in a single 3D plot'

  • September 15, 2017
  • 2 replies
  • 4703 views

Dear all,


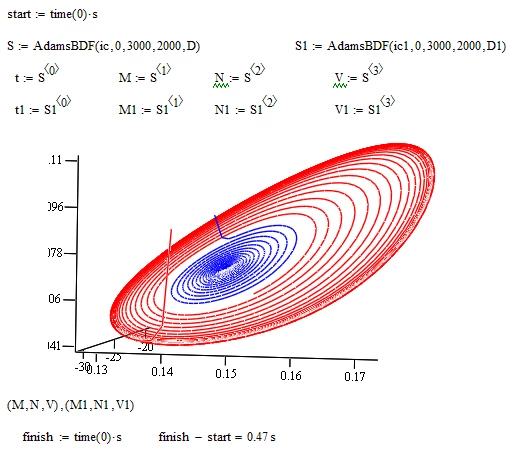
I want to combine two 3D plots (M, N, V) and (M1, N1, V1)


into a single 3D plot in Mathcad.


I attached my code below.


Could anyone help me


Thanks.


Best answer by ViktorKorobov

@terryhendicott wrote:

Hi,


You are plotting way too many points in the combined plot 400,002 points.  This will take Mathcad forever to plot.

Enclosed is a program that samples every five points of M,N,V and M1,N1,V1 into shorter arrays Ms,Ns,Vs, and Ms1,Ns1,Vs1.  It takes Mathcad minutes to show finally the plots of these two curves in a 3D plot.  Each plot can have its own appearance.  Here I chose red and blue scatter plots.   I am not sure how long it will take if you leave MathCad to plot the 400,002 points


The bottom left of the 3d graph is like this (Ms,Ns,Vs),(Ms1,Ns1,Vs1)  Hope this helps


Without undue difficulties, we can do a quick calculation if you reduce the number of integration steps.PhasePortrait.png
2 replies

1-Visitor
September 15, 2017

See attached file.

21-Topaz II
September 15, 2017

Hi,


You are plotting way too many points in the combined plot 400,002 points.  This will take Mathcad forever to plot.

Enclosed is a program that samples every five points of M,N,V and M1,N1,V1 into shorter arrays Ms,Ns,Vs, and Ms1,Ns1,Vs1.  It takes Mathcad minutes to show finally the plots of these two curves in a 3D plot.  Each plot can have its own appearance.  Here I chose red and blue scatter plots.   I am not sure how long it will take if you leave MathCad to plot the 400,002 points


The bottom left of the 3d graph is like this (Ms,Ns,Vs),(Ms1,Ns1,Vs1)  Hope this helps

1-Visitor
September 15, 2017

@terryhendicott wrote:

Hi,


You are plotting way too many points in the combined plot 400,002 points.  This will take Mathcad forever to plot.

Enclosed is a program that samples every five points of M,N,V and M1,N1,V1 into shorter arrays Ms,Ns,Vs, and Ms1,Ns1,Vs1.  It takes Mathcad minutes to show finally the plots of these two curves in a 3D plot.  Each plot can have its own appearance.  Here I chose red and blue scatter plots.   I am not sure how long it will take if you leave MathCad to plot the 400,002 points


The bottom left of the 3d graph is like this (Ms,Ns,Vs),(Ms1,Ns1,Vs1)  Hope this helps


Without undue difficulties, we can do a quick calculation if you reduce the number of integration steps.PhasePortrait.png

vveeran4-ParticipantAuthor
4-Participant
September 15, 2017

Thanks a lot Viktorrobov for your reply.

But, I have some doubt in plotting 2 3D plots.

When I draw 2 3D plots,  plot 1 is plotted using lines from appearence tab

and the plot 2 is plotted using wireframe from appearence tab. 

In the appearence tab, I can't find lines option in plot 2. 

I want to know, 'How to choose lines options for plot 2 from the appearence tab ?'


In plot 1, I saw the following in the appearence tab,

Line options

* Lines

* Contour lines

*No lines


whereas in plot 2, I saw the following,

Line options

*Wireframe

*contour Lines

*No lines


I can't find lines option in plot 2.

How to choose lines from the appearence tab in plot ?


I attached the code here.