

1-Visitor
September 9, 2016
Solved

MathCAD 15 plot scale off

  • September 9, 2016
  • 1 reply
  • 2158 views

Good day all,

I developed a stress analysis sheet however at the end there are some general equations that I have to represent some forces.

However the plots have the corrct shape yet the axis values are off. For example my y-axis boundary conditions are 0 and about -80, yet the graph plots 0 and -800. My horizontal axis should be labelled from around 5 to 6 with 0.1 increments, yet shows 0.4 to around 0.52 with 0.1 increments.

Can someone take a look and see if they can spot the problem ?
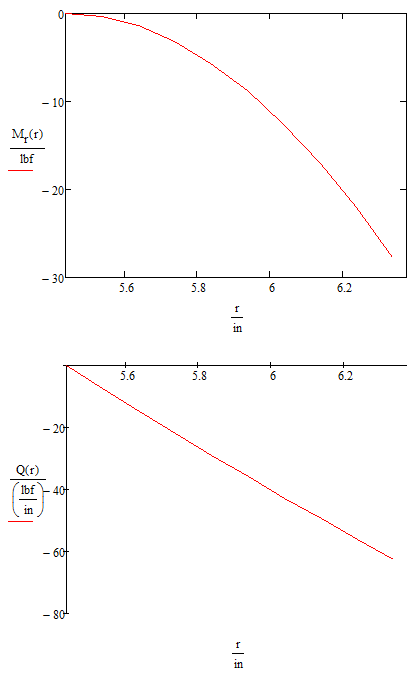
Best answer by MJG

Units.

Mathcad strips the values of their units for plotting.  Since everything is stored in SI units in the background, the plot shows the values that correspond to those SI units.  You have to divide your variables by the units you which to see plotted.

1 reply

MJG1-VisitorAnswer
1-Visitor
September 9, 2016

Units.

Mathcad strips the values of their units for plotting.  Since everything is stored in SI units in the background, the plot shows the values that correspond to those SI units.  You have to divide your variables by the units you which to see plotted.

1-Visitor
September 9, 2016

Thank you very much!

I would have thought Mcad 15 and Prime would automatically adjust for units.

19-Tanzanite
September 9, 2016

How? Mathcad cannot know what units you want for a plot (I have asked for the "mind reading" feature several times, but they always seem to have other priorities ).