1-Visitor
April 12, 2013
Solved

Mathcad help :(

  • April 12, 2013
  • 9 replies
  • 17058 views

Hello, my name is Alex and i am a student at the Polytechnic University of Bucharest.

I have never used this software before and it is getting very dificult finding what i need.

My industrial design teacher has given me some equation stuff to work, but i never used mathcad.

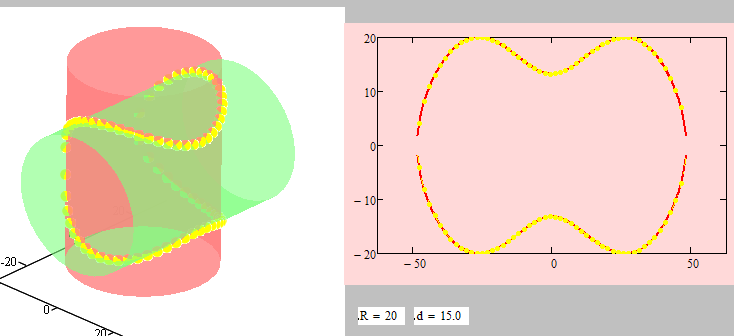
I have to create in mathcad 2 cylinders that would intersect and after that make some calculations.

The first is vertical and the second should passthrough the first but horizontaly, i've attached a photo, hope this will be usefull.

Pic_0412_055.jpg

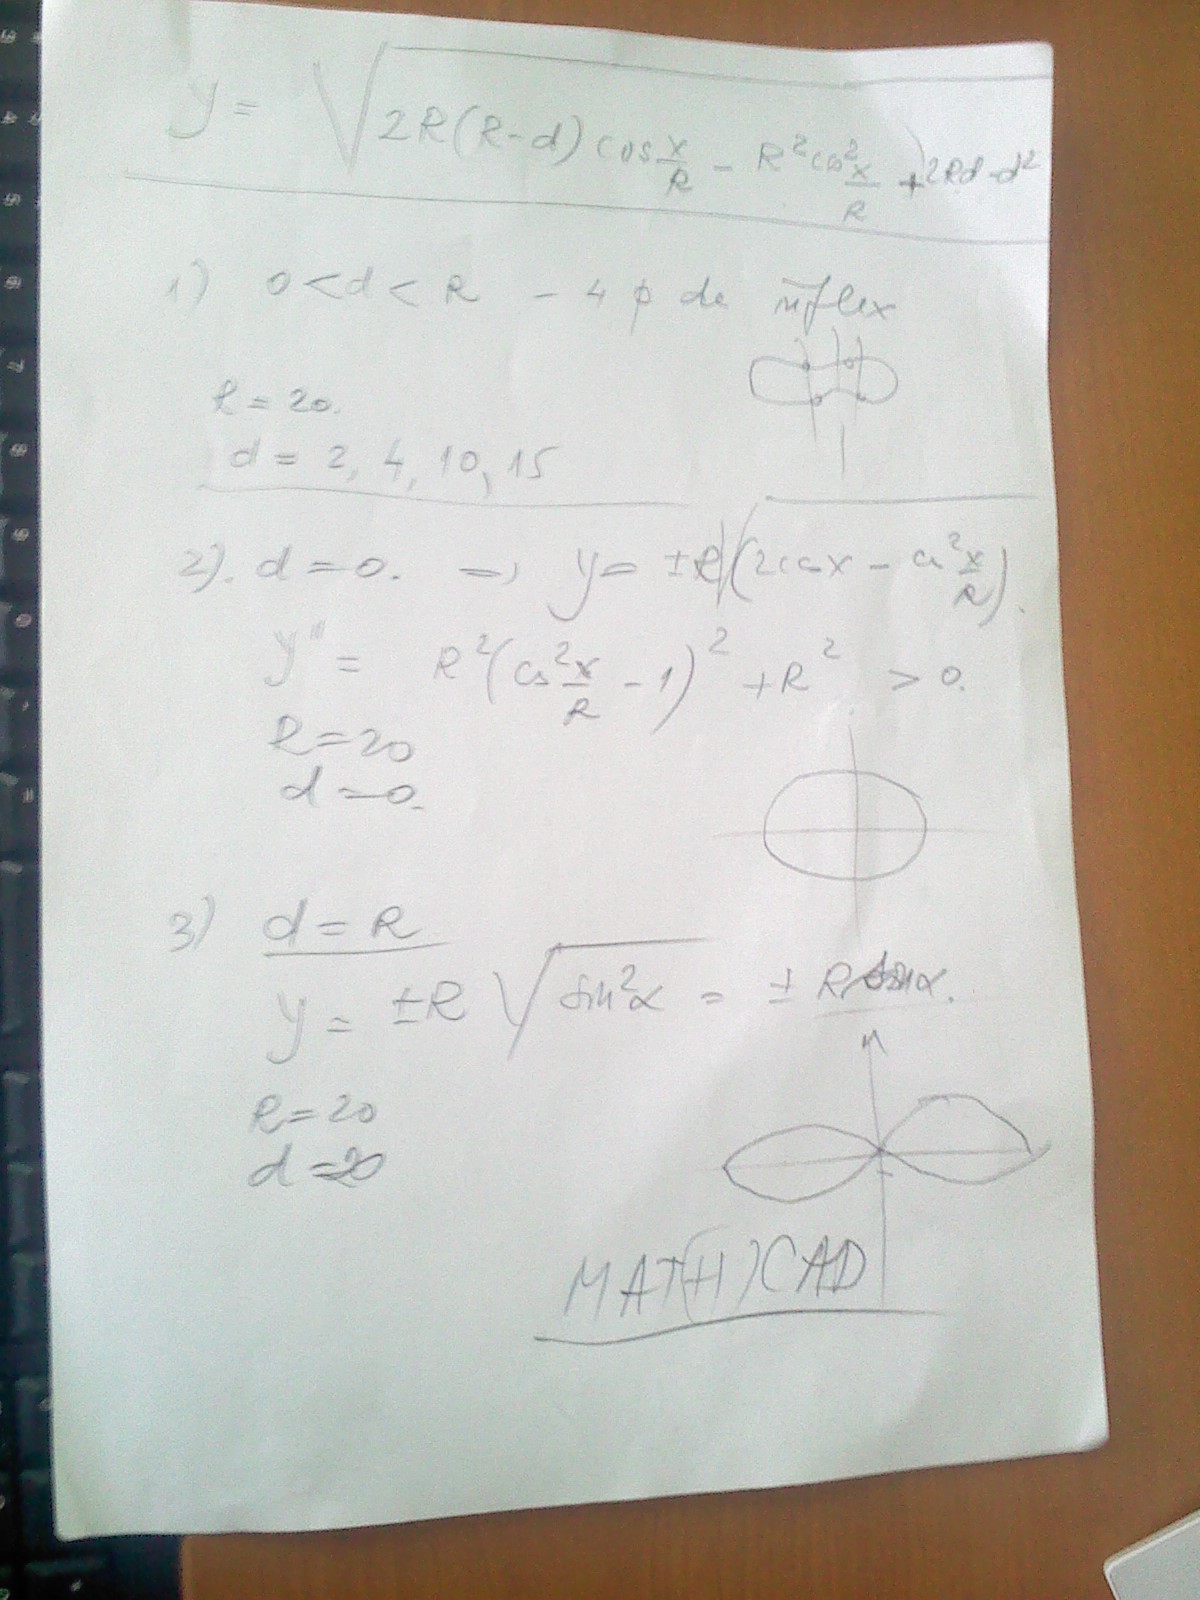
He explained me that there ar 3 scenarios i need to test, all based on assigning a diferent value to "d".

Please help if can

Best answer by Werner_E

I don't know what the real needs are, either.

It looks to me as if the graph which is described is the flatprojection/unrolling of the intersection of two orthogonal cylinders of same size. d being some kind of offset. d=r meaning that the axis of the cyliniders intersect and the cylinder intersection collapsed into two ellipses which unroll to two sines. But then, i may be wrong - the formulas I came up with are slightly different from those posted.

Zylinder.png

9 replies

25-Diamond I
April 12, 2013

Please attach a Mathcad worksheet with what you had tried so far.

What are you after? equations? 2D-plots? 3D-plots?

19-Tanzanite
April 12, 2013

See attached. It should at least show you how to start.

Alan

1-Visitor
April 12, 2013

Hello, thank you for replying so short.

The plot is 2D, i will reply as soon as i can.

I am getting a wrong format error, i am using Mathcad Prime 2.0

I must appologize, i dont know about anything about inserting radical equations.

Regards,

Alex.

19-Tanzanite
April 12, 2013

Here is a Prime 2 version.

Alan

1-Visitor
April 12, 2013

Thank you Alan, thats just wow what you did there, i wish i could find a starter tutorial on mathcad

19-Tanzanite
April 12, 2013

Alexandru Hera wrote:

... i wish i could find a starter tutorial on mathcad

Click on help (the question mark at the top-right of Prime 2). There is a tutorial there:

Tutorial.PNG

Alan

1-Visitor
April 12, 2013

For better explaining Alan, hope you can understand exacly whan i need

eweae.jpg

the first scenario allows me to alocate multiple values to d and represent them.

19-Tanzanite
April 12, 2013

Alexandru Hera wrote:

For better explaining Alan, hope you can understand exacly whan i need

...

Err...no!

1. What is the orientation of your 2nd cylinder? 2. What, exactly is it you are trying to calculate? Your first post suggested a number of discrete values of d. Are you now looking for a plot of y as a function of d?

I'm afraid I'll need a more detailed explanation/better drawings (make them 3D?).

Alan

1-Visitor
April 12, 2013

Well, i am trying to calculate y based on the d value, 2d not 3d

The orientation is straight throught the first, like a nail.

1-Visitor
April 15, 2013

Making this subject up

Alan what you did was what i needed, now that i got more details i would like to know if you can help me take this a bit further.

But for the record, my teacher was impressed

@Werner: the graph you made was really usefull as i got max points for this preview.

19-Tanzanite
April 15, 2013

Glad to have helped. To get further help with Mathcad related problems you only need to post your questions here and I and/or others will probably help.

Alan

1-Visitor
April 15, 2013

Okay, to get started, the title of the paper.

Graphic-analytical study of the curve of intersection of two cylinders of rotation

Pic_0415_057.jpg

R - circles radius (same size)

d - distance between the cylinders axes

M (m,m') - intersection point

x = Rα (from the horizontal projection)

α = x/R

25-Diamond I
April 15, 2013

So at least a sketch worth the paper drawn on.

As far as I see its exactly the same thing we had before with one exception. The distance d is now more meaningful. In the equation of your first posting the variable d was the difference from R and the new variable d now, This would affect the equation, of course as d=0 now means we have two ellipses as intersection and therefore two sines as flat projection, and d=R would mean a curve without inflection points - exactly the opposite from the prior post.

The equation would be

equ.png

and if the goal is graphing, then Alan had already provided the way to do.

Think its time for you to fire up Mathcad and create your own worksheet. Come back if there is anything not working.

BTW, in your sketch (is it yours?) you have different x-axis with different meaning - can be confusing.

1-Visitor
April 15, 2013

Well, from the paper i have y^2= R^2 - (d-x1)^2, but thats so close.

I'll get to work.

1-Visitor
April 16, 2013

I've tried to reproduce the results, failed at plot

25-Diamond I
April 16, 2013

Alexandru Hera wrote:

I've tried to reproduce the results, failed at plot

Whats wrong? Plots look OK here?

You don't see the lower half of y8 because above you have written y15:=stack(... instead of y8:=stack(...

You did this with other vectors, too, so I guess you are not sure what that command y8:=stack(y8,-y8) is for.

It simply stacks the points of the upper half (y8) on top of the points of the lower half of the curve and it would make more sense to assign it a variable with the same number (y8). As you have written it you would have to draw y2 to see the plot for d=14 which doesn't seem to be that comfortable.

1-Visitor
April 17, 2013

Yes, but how is it made with mathcad? cuz i want to modifiy the graph for any scenario in the theory, and for every y value.

Hmm, here are the other 2 scenarios.

#1 - Case when d = R

#2 - Case when d = 0

#3 - Case when 0 < d < R

Pic_0415_058.jpg

Pic_0415_059.jpg

25-Diamond I
April 25, 2013

Alexandru Hera wrote:

Yes, but how is it made with mathcad? cuz i want to modifiy the graph for any scenario in the theory, and for every y value.

I sent you all I have - unfortunately in MC15 format. If you can't model it in another software (preferably a 3D CAD for better results) you may consider using the free 30day eval version of Mathcad15.

Find attached a pdf from that file. At least plotting the two cylinders should work the same in Prime - plotting the intersection in 3D will need some different rework but probably is not necessary at all.

If you are just after a pic for every case you could use one of the animations I posted, pause the film, pull the slider to the position you want and take a screen shot.

Good luck!