16-Pearl
July 17, 2019
Solved

Mathematical curve

  • July 17, 2019
  • 3 replies
  • 4035 views

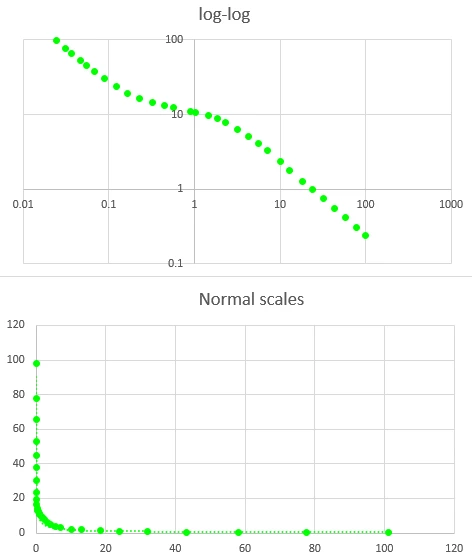
Anyone happen to know a mathematical equation that would represent data like this (an s-curve in a log-log plot)?  Excel attached.

Thanks!
 

2019-07-17_13-09-22.png

Best answer by LouP

This looks like a linear system frequency response, with complex frequency s = jx. Real poles at s=0 and s~2, real zero at s~0.2. the attached shows a simple rational approximation (one zero, two poles) that fits reasonably well. The attached pdf shows a minerr optimization of the form.


Is the data in fact a linear system frequency response?


Lou


3 replies

24-Ruby IV
July 17, 2019
25-Diamond I
July 17, 2019

@DJF wrote:

Anyone happen to know a mathematical equation that would represent data like this (an s-curve in a log-log plot)?  Excel attached.

Thanks!



I would say that depends what you would need the equation for. In most cases, you know the function type for this process, and then it's all about finding the appropriate parameters using the measurement data.

If you doesn't know anything, then usually a simple interpolation (linear or spline) is all thats needed.


Here is a similar approach than Valery's (polynomial fit of the logarithmized data) but done on the original data.

B.png

DJF16-PearlAuthor
16-Pearl
July 17, 2019

Thanks WE and Valery.  I was hoping for something besides a polynomial or spline that passes through everything.  Guess I should have stated that.  I'm looking for a fundamental curve that has that shape.  (I never found one myself).   (You'd think someone would have compiled master lists of equations and their shapes, but I guess that's too much to ask.  Maybe when I retire....)

DJF16-PearlAuthor
16-Pearl
July 18, 2019

Hold on, this isn't too bad.  Even pretty good without the d and e exponents.2019-07-17_19-17-36.png

LouP12-AmethystAnswer
12-Amethyst
July 18, 2019

This looks like a linear system frequency response, with complex frequency s = jx. Real poles at s=0 and s~2, real zero at s~0.2. the attached shows a simple rational approximation (one zero, two poles) that fits reasonably well. The attached pdf shows a minerr optimization of the form.


Is the data in fact a linear system frequency response?


Lou