
1-Visitor
April 6, 2016
Solved

my plot is not showing the right values

  • April 6, 2016
  • 2 replies
  • 2624 views

Hi I am a newbie with Mathcad,

I got something weird going on, that is when I am using the plot function to plot my equation, I don't get the y values in the chart matching the values of the actual function.

If I start with a blank new worksheet it works just fine and I can't figure out what is wrong with the existing worksheet.

The function I am trying to plot is Vmagn vs Imagn. Vmagn has the equation shown and will plot in y axis, the Imagn is a range of values and it will be the X-axis.

Attached are the worksheets :

Plot_with_no_problem.xmcd

Plot_with_problem.xmcd (about Page 8- 9)

The Vmag in the Plot_with_problem.xmcd worksheet is a lot higher then what it should.

As you can see Vmag should start at 108 but somehow it starts at 2550.
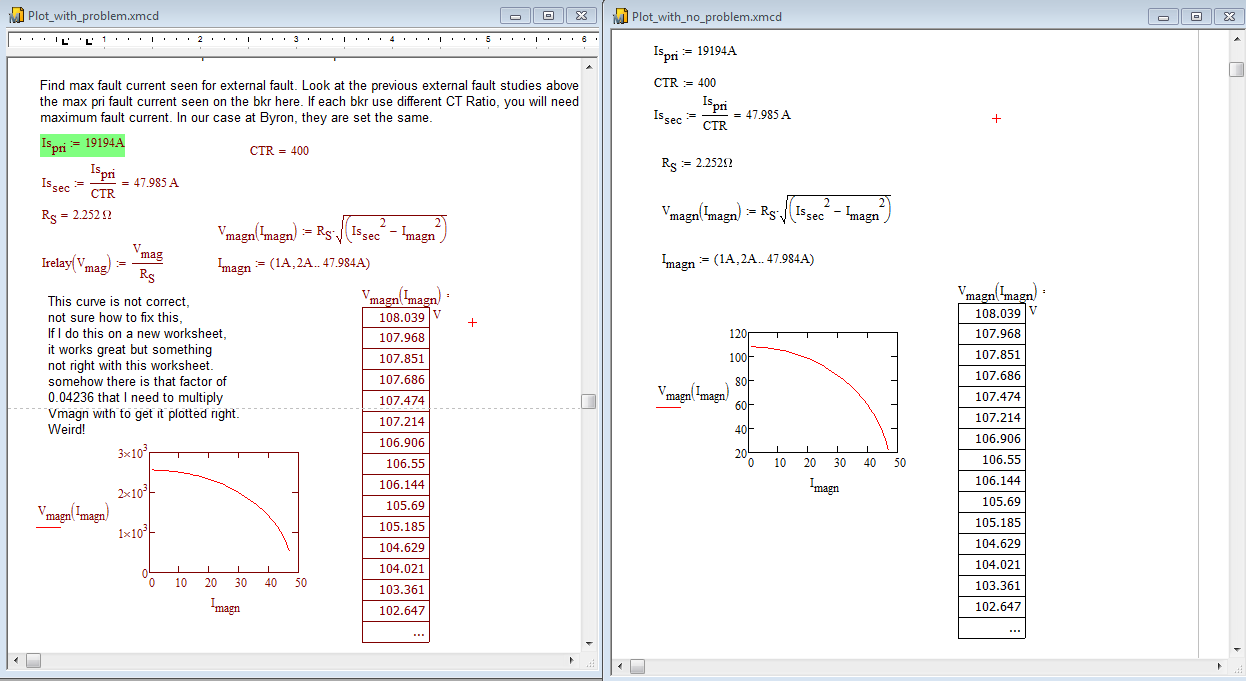
Let me know if you find the cause of this problem.

I am using Mathcad 15.0

Thanks,

Adi.

Best answer by amulawarman

This works too. Thanks.

Awesome community support.

2 replies

1-Visitor
April 6, 2016

Not sure what's causing the problem.  However, whenever graphing variables with units, it's good to divide by the expected display units.  This fixes your problem:

1-Visitor
April 6, 2016

That works. Thanks.

12-Amethyst
April 6, 2016

Hi ,

    I think that the difference is the unit system that you are using.

If you go into the Tools option on the top tool bar,

and then 'worksheet options'.

Finally choose the Unit system tab,

In the sheet that works the default units is set to 'SI'

In the one that doesn't work, it is set to custom.

I changed this to 'SI' and I get the 'correct' graph.

Hope this helps

Andy

amulawarman1-VisitorAuthorAnswer
1-Visitor
April 6, 2016

This works too. Thanks.

Awesome community support.