1-Visitor
February 16, 2022
Solved

plot variable range

  • February 16, 2022
  • 1 reply
  • 1288 views

Hi,


I'm trying to plot a function but I get an error and I'd like to ask:

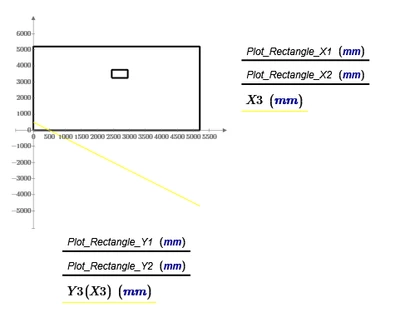
Can I define a variable in a range between two other variables? and if not, how can I do it differently. Please see X3 variable and Y3(X3) function.


thanks,

Eleni


Best answer by LucMeekes

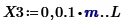
The error message is pretty clear. You have defined X3  as a range from 0 to L, but L has a unit (m), so Prime wants you to provide the second value in the range. Define:

LucMeekes_0-1645015351699.png

(Just type a comma between the 0 and the .. and you'll see where you can add the 0.1*m. Make sure that m is a unit) and your first problem is gone.

Regarding the plot: You have defined Y3 to be a function of X3. If you want to plot it, you have to call it with an argument.

So on the horizontal axis change Y3 to

Y3(X3)

and your Plot is without error. You may want to set the units for the Y3(X3) trace to mm...

LucMeekes_1-1645015370359.png

Success!

Luc


1 reply

LucMeekes23-Emerald IVAnswer
23-Emerald IV
February 16, 2022

The error message is pretty clear. You have defined X3  as a range from 0 to L, but L has a unit (m), so Prime wants you to provide the second value in the range. Define:

LucMeekes_0-1645015351699.png

(Just type a comma between the 0 and the .. and you'll see where you can add the 0.1*m. Make sure that m is a unit) and your first problem is gone.

Regarding the plot: You have defined Y3 to be a function of X3. If you want to plot it, you have to call it with an argument.

So on the horizontal axis change Y3 to

Y3(X3)

and your Plot is without error. You may want to set the units for the Y3(X3) trace to mm...

LucMeekes_1-1645015370359.png

Success!

Luc


1-Visitor
February 16, 2022

Thanks Luc,


much appreciated.