5-Regular Member
Feb 14, 2023 2:43 PM UTC
Solved

Plot XY with two different X scales

Hi all

Please, see the attchd.file, mathcad prime 3.1.

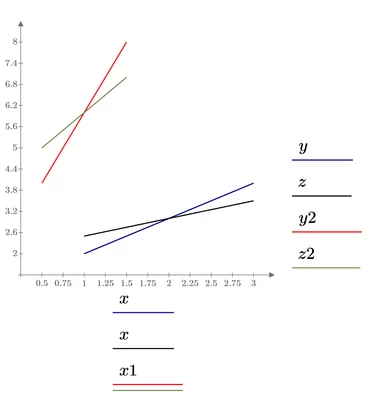
There is a graph where I would like to have parameters y and z related to x axis scale and parameters y2 and z2 related to x1 axis scale in the same graph. I have absolutely no idea how to define which x coresponding with which y for plots where are a several different x.

Does anybody have an idea how to do that?

Thx a lot

Rosta



Werner_E
Werner_EAnswer
25-Diamond I
Feb 14, 2023 3:06 PM UTC

Simply repeat/duplicate the "x" at the abscissa.
You may also duplicate the "x1" but its not necessary as the last entry at the abscissa will be used for all subsequent traces

Werner_E_0-1676387186753.png


3 replies

Werner_E
Werner_E25-Diamond IAnswer
25-Diamond I
Feb 14, 2023 3:06 PM UTC

Simply repeat/duplicate the "x" at the abscissa.
You may also duplicate the "x1" but its not necessary as the last entry at the abscissa will be used for all subsequent traces

Werner_E_0-1676387186753.png


Translate
5-Regular Member
Feb 14, 2023 3:20 PM UTC

So easy, it works, cool...

Thx

Translate
24-Ruby IV
Feb 14, 2023 7:13 PM UTC

For me the Plot XY with two different X scales is so

KC.png

Translate