
1-Visitor
November 1, 2014
Question

Plotting a function of one variable on contour plot (Mathcad 14)

  • November 1, 2014
  • 5 replies
  • 2025 views

Hello,

I would like to make a contour plot of function of one variable(pressure distribution in one dimension element, at fixed time moment). I wish it would look more or less, like Mathcad prime contour plot legend.
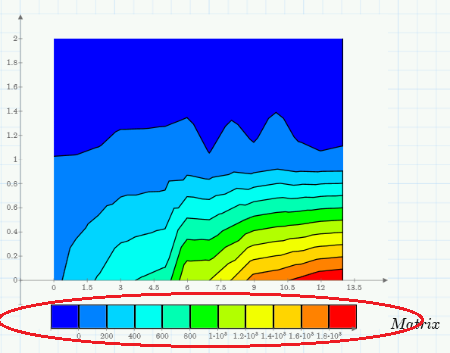
plot.bmp

Every attempt fails with "Cannot interpolate 3-D scatter data. These points all lie in a line"

Thank you for any help.

5 replies

Werner_E
25-Diamond I
November 1, 2014

You can't make a countour plot of a function in just 1 variable!

Are you looking for something like this?

1.png

23-Emerald V
November 1, 2014

Werner Exinger wrote:

You can't make a countour plot of a function in just 1 variable!

Are you looking for something like this?

I think he wants it with "y" constant, something like f (t, u)=p (t), with CreateMesh (f,tmin, tmax, 0,1,20,2) - replacing 20 with as many points in the t axis as are needed to give reasonable smoothness.

Stuart

I'm Mathcadless at weekends and week evenings, so can't check.

Werner_E
25-Diamond I
November 1, 2014

You are probably right guessing what Micheal needs.

I was thinking that he just wants to add a color legend and was trying with a function of one variable to achieve this goal.

BTW, thats the collapsed region in my sheet showing two approaches for a legend (the second being the preferred one):

1.png