
1-Visitor
April 13, 2020
Solved

PLOTTING A GRAPH CONTAINING "Gamma" FUNCTION in PRIME

  • April 13, 2020
  • 2 replies
  • 3369 views

Hello,

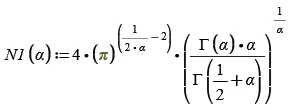
I can plot graph involving "Gamma" function in MathCad 15, but in Prime, either nothing happens or it gives error message saying that "This must be a real number".

Help will be very much appreciated.

Thanks,

Anousheh

PS: Plot of N1(alpha) against alpha    (I have defined alpha as a variable)
 

Anousheh_0-1586793063234.png


Best answer by LucMeekes

See Fred's example, where he defined a range for alpha.

For an x going from 0.4 to 0.5 in steps of 0.01, you'd define:

x:=0.4, 0.41 .. 0.5

(The first value, 0.4, is the starting value. After the comma follows the second value, and after the .. is the last value of your range.  So the 'step'  is equal to the second minus the first value. If you don't provide a 'step' it defaults to 1. That's not handy in your case.)


Success!
Luc

2 replies

23-Emerald IV
April 13, 2020

Please attach the Prime worksheet that contains your attempt.

Luc

Anousheh1-VisitorAuthor
1-Visitor
April 13, 2020

Hello LucMeekes,

Thanks. OK. sending it soon.

Regards

21-Topaz II
April 13, 2020

M15,

answer to Anousheh.jpg

Anousheh1-VisitorAuthor
1-Visitor
April 13, 2020

Hello -MFra-,

Thanks a lot.

I have no problem with MathCad 15.

Prime is the problem. Please see the attached Prime file.

Really appreciate this.

23-Emerald I
April 13, 2020

FredKohlhepp_0-1586807724604.png

I have only Express, so the  G function is not available to me, but this is how to plot inside mathcad.  N2 function plots just fine.