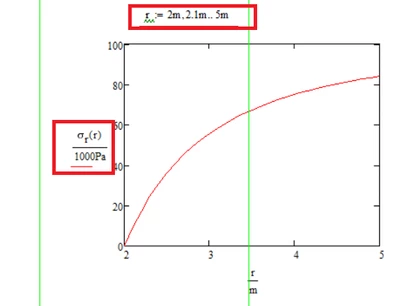
I am trying but cannot figure out what I am doing wrong. It is to understand the overall mistake that I have been doing again again. Why do you think I cannot plot this?
You actually have created a plot, you simply don't see it. The plot consists of just one single point at (2/0).
The reason for this is that you defined r:=2m at the top and so thats the only r-value used in the plot.
You may either use a different variable instead of r in the plot (I often use a variable like r. because the the dot is not visible if the focus is off the plot region), or you redefine r as a range variable in front of the plot:
I guessed you did not want to see the ordinate values in MPa (you would have divided simply by MPa then) but expected the, to be in kPa. So you either have to divide by kPa or by 1000 Pa.
EDIT: Oops, had not seen ssate's reply when I started mine. Looks like I am way to slow 😉
Translate
Windchill Satisfaction Survey
Help shape the future of Windchill. Take our 5-minute survey and share your feedback.