1-Visitor
August 7, 2019
Solved

Plotting simple 2d graphic from adjacency matrix and a homogeneous data matrix

  • August 7, 2019
  • 4 replies
  • 3349 views

Hiya,


(Mathcad Noob here 🙂 )

I'm trying to get Mathcad Prime to do a relatively simple plot using an adjacency matrix and homogeneous data points.

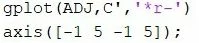
In Matlab I can do this quite simple like so:
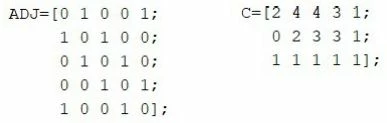
screenshot.19.jpg   


screenshot.20.jpg

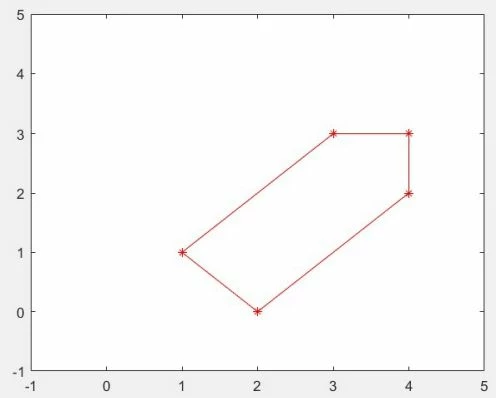
Which results in this:

screenshot.21.jpg


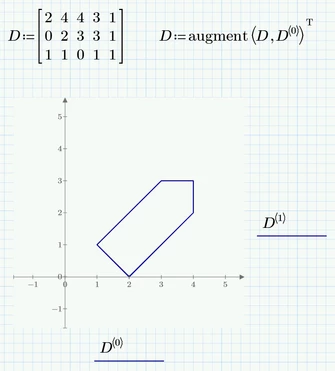
Now if I try to the same in Mathcad I get this (dont mind the 3d plots, just fiddling around):
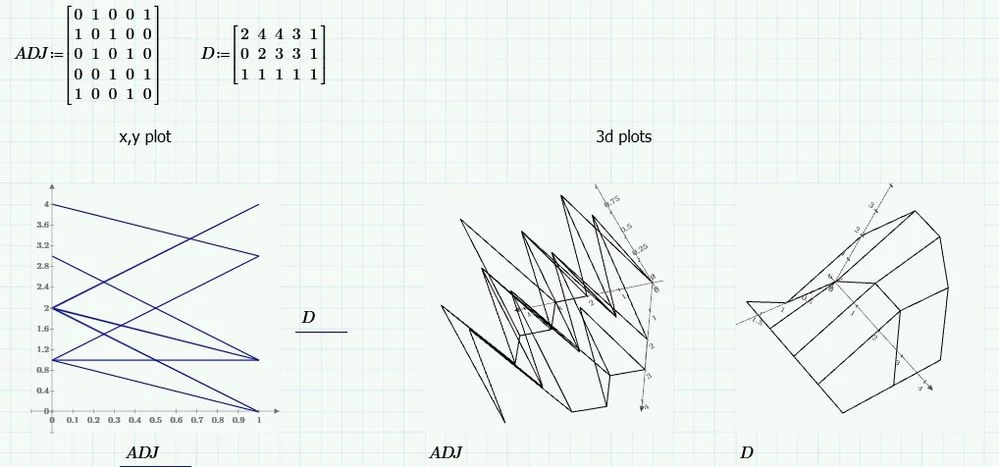
 

screenshot.22.jpg


I'm sure its because I don't know what I'm doing, since I'm still relatively new in mathcad. And it might even not be possible to do in Mathcad. But I was hopeing someone could enlighten me.


Thanx.

Best answer by Werner_E

Unfortunately Prime does not offer the nice plot functions Matlab provides.

But you may create your own functions depending on your needs.

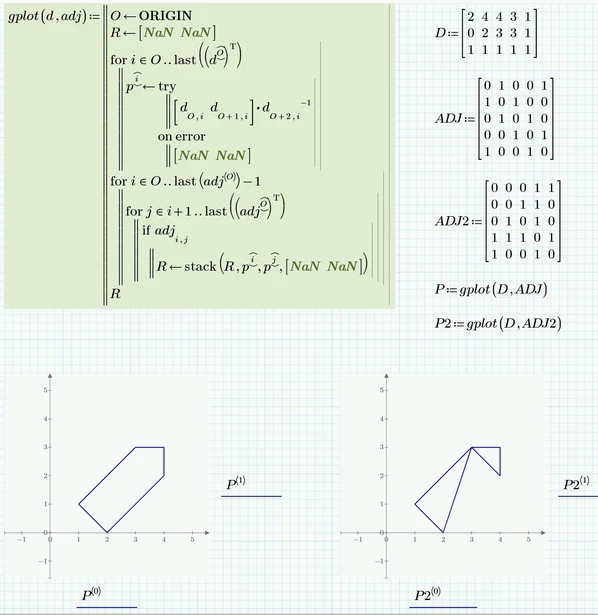
If the list of points is contiguous, in the correct order and the third coordinate of the homogeneous coordinates is guaranteed to be always 1, this (similar to Lucs approach) would be the most easiest way:

B1.png

But if this easy approach is not applicable you have to resort to writing your own function. I created a function "gplot" (by no means as universal as Matlab's, of course) which does what I think you'd like to be done. I am taking into account the upper right half of the symmetric adj matrix only and distinguish only between zero and non-zero value.

Just a quick hack - hope it helps.

B2.png

Prime 5 worksheet attached.

4 replies

23-Emerald IV
August 7, 2019

I have no idea what an adjacency matrix is, neither why you need it to get the plot you're after, given matrix D.

Does the attached help?


Success!
Luc

Werner_E25-Diamond IAnswer
25-Diamond I
August 7, 2019

Unfortunately Prime does not offer the nice plot functions Matlab provides.

But you may create your own functions depending on your needs.

If the list of points is contiguous, in the correct order and the third coordinate of the homogeneous coordinates is guaranteed to be always 1, this (similar to Lucs approach) would be the most easiest way:

B1.png

But if this easy approach is not applicable you have to resort to writing your own function. I created a function "gplot" (by no means as universal as Matlab's, of course) which does what I think you'd like to be done. I am taking into account the upper right half of the symmetric adj matrix only and distinguish only between zero and non-zero value.

Just a quick hack - hope it helps.

B2.png

Prime 5 worksheet attached.

tlutze1-VisitorAuthor
1-Visitor
August 12, 2019

It looks promising, I'll test it and see if it works as I think it will.

I'll report back.
thanks so far.

ttokoro
21-Topaz I
August 8, 2019

Some examples from this community.

T. Tokoro.

3D-plot.png3D-plot-y.png


star3D.png

t.t.