12-Amethyst
May 20, 2017
Solved

Plotting the components of a matrix column vs the column

  • May 20, 2017
  • 2 replies
  • 1465 views

Hello to all,

I do not know if the title of my discussion is ok, but this is what I need:

I have a matrix column M with a total of n rows, and I want to plot how the components M(n,1) change in function of n. Is there any way in Mathcad to do this?

thank you in advance,

Rogelio de las Casas

Best answer by Werner_E

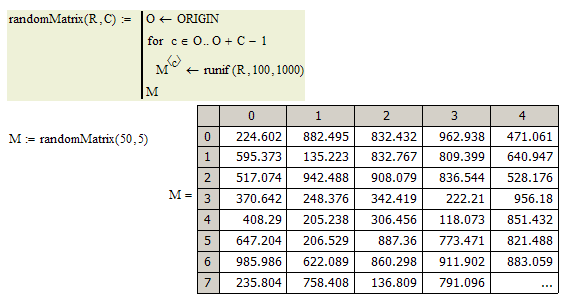
OK, lets first create a dummy matrix with random values:

Now two ways to get the plot you are looking for:

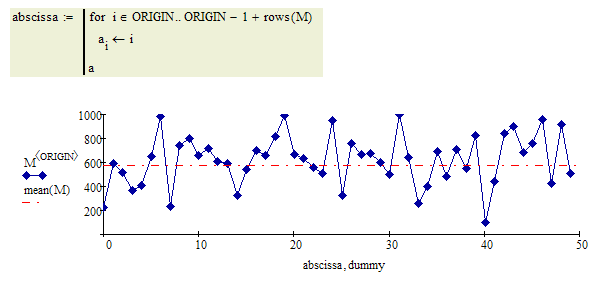
1) Create a vector with row indices (here values from 0 to 49) and plot the first column over this vector

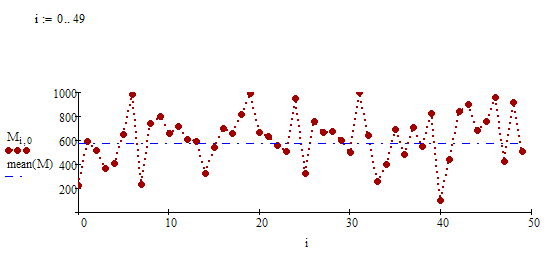
2) Create a suitable range variable (here from 0 to 49) and plot M(n,0) over that range

2 replies

Werner_E25-Diamond IAnswer
25-Diamond I
May 20, 2017

OK, lets first create a dummy matrix with random values:

Now two ways to get the plot you are looking for:

1) Create a vector with row indices (here values from 0 to 49) and plot the first column over this vector

2) Create a suitable range variable (here from 0 to 49) and plot M(n,0) over that range

12-Amethyst
May 20, 2017

Thank you very much Werner,

Kind Regards,

Rogelio