
10-Marble
September 29, 2022
Question

Prime 7.0 Gridlines Still Missing...any appearance in Prime 8.0 or word of it in v9.0?

  • September 29, 2022
  • 1 reply
  • 2679 views

I am aware of the 'klugy' workaround (my impression and the lack of efficiency/speed) using the Math...Insert Chart Component tool/button, but for a simple, quick few clicks the 27 years of using MathCAD got rid of the basic plot tool's ability to create and customize simple gridlines. It also appears to have removed the TraceXY feature, where you can actively move the cursor, point by point along the curve to see the X, Y values at each point.


As it stands in v7.0, the vertical and horizontal 'markers' are independent of the curve or data points, making it unusable for the old TraceXY tool since it will contain random error in both X and Y values.
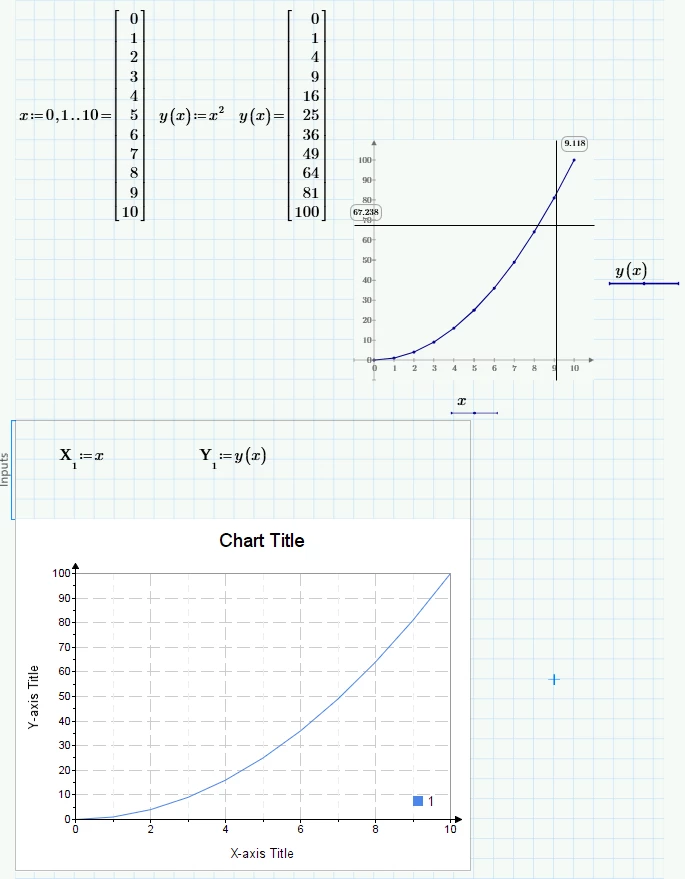
 

09-29-2022-v7-plot-gridlines-still-missing.PNG

1 reply

DJNewman
18-Opal
September 29, 2022

Hiya,


AS you know, the Chart Component is PTC's suggested tool to use for presentation-worthy and feature-rich plots in PTC Mathcad Prime. We're aware of and always happy to hear customer feedback on how we can improve Mathcad; but in our list of priorities to put in the next release, updates to plots weren't in Prime 8 and won't be in Mathcad Prime 9. We're still prioritising closing the feature gaps we have with Mathcad 15, so merging the functionalities of native plots and the Chart Component into one feature instead of two isn't as high on the list (but is still certainly on the list), as we are prioritising adding functionality that isn't yet possible to do in any form in Mathcad Prime.
In the meantime, I encourage you to vote up existing ideas (and/or make your own if you don't see them) on the Mathcad Ideas board.

PTC Marketer for Creo and Mathcad. I run their YouTube channels, some Creo campaigns, and all Mathcad campaigns and communications.
10-Marble
October 4, 2022

Hi, 


I'm baffled that a basic & simple functionality deficiency takes so much perceived effort & resources compared with the complex, corner-case upgrades in other areas and features of the software that most users will never use. 


I consider the Chart Component a band-aid, but it is overly complicated, it's hard to believe that was more simple than incorporating what has been a standard tool in MathCAD versions over the past 20+ years.


I am in strong disagreement that adding more functionality takes priority over fixing widespread problems & limitations of a simple, basic functionality that pretty much every customer comes across and agrees is a frustrating limitation with only band-aid workarounds. 


I will vote up ideas and add more if I don't see them, but I've spent a tremendous amount of time just trying to deal with the horrific conversion outcomes of converting older MathCAD worksheets to Prime, so I'm already overspent on this counterproductive troubleshooting and searching for workarounds.

ttokoro
21-Topaz I
21-Topaz I
October 4, 2022

We can do Prime 8 is only this plot with trace XY.

image.png

t.t.