Best answer by Fred_Kohlhepp

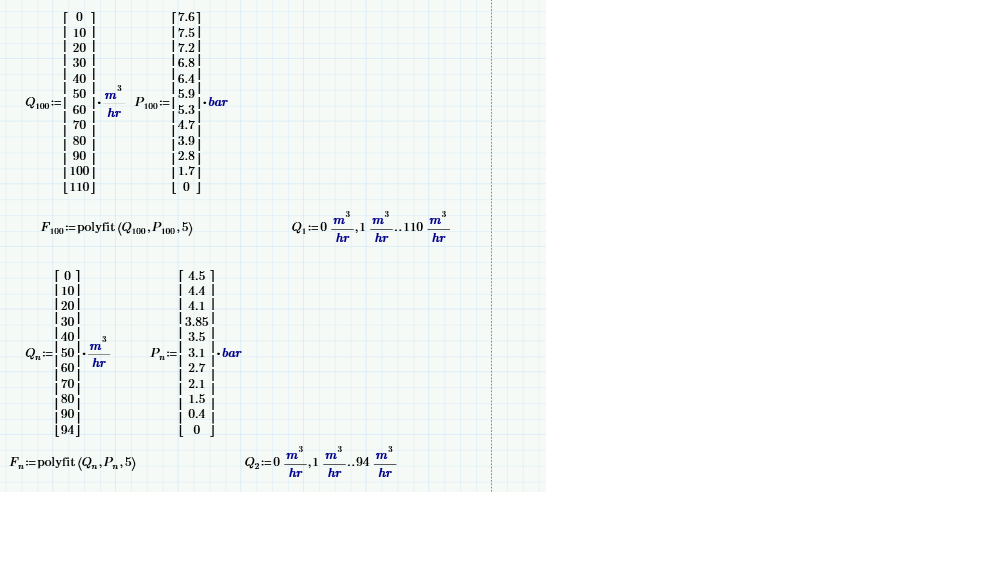
If I assume that your pressure is the discharge pressure at the pump, then pumps in parallel have their flow rates add based on discharge pressure.

22 replies

23-Emerald I
May 6, 2016

If I assume that your pressure is the discharge pressure at the pump, then pumps in parallel have their flow rates add based on discharge pressure.

1-Visitor
May 6, 2016

That is excactly how it should turn out.

I was wondering how I could learn more about MathCad, there is so many things I would like to learn. Do your know any websites besides this page?

23-Emerald I
May 6, 2016

For help with Mathcad, this is probably your best forum--there is a lot of experience here.

1-Visitor
May 7, 2016

I just noticed that the flwn does not hit 4.5 bar. Could that somehow be done in another way.  Maybe by programming?

I have just bought the book "Essential PTC Mathcad Prime" to improve my mathcad skills

23-Emerald I
May 9, 2016

Well, it does, its just not zero as you'd like:

The function "polyfit" does a least-squares development of the coefficients of a polynomial fit, in the case of the graph above a second order polynomial.  A third order fit got me 2.899 m^3/hr, Fourth order got 2.401, fifth got 1.819.  You can do other fits--a spline fit will pass thru points exactly.  Be careful, a seventh order polynomial seems closer to reality at 4.5 bar, butstrange things start to happen:

How close is "close enough"?

1-Visitor
May 9, 2016

Close enough is when i hit all the given marks, and I'm having a smooth curve - if it is even possible. I have just tried lspline, and it is not giving me a smooth curve.

I have tried both l, c and pspline, and I have no clue what the difference is between them.

1-Visitor
May 10, 2016

"flwn" is not a regular polyfit "vsn" is.

I guess Fred made it this way because I have to combine them to a system curve.

I have attached an image which shows the difference between "flwn" and "vsn", and the combined curve .In the combined curve I would like to replace flwn with vsn, but I can't figure out how to do that. I hope I made myself understandable.

I really appreciate your help.

23-Emerald I
May 10, 2016

When the discharge pressure gets to 4.5 bar, the pump cannot push any more fluid.  A curve that is built from the data points would predict a negative flow at a higher pressure; I chose to assume that for higher pressures the pump would stop producing flow but would resist attempts to push fluid back thru it, So flw becomes zero if the extrapolated curve is negative: 

You can simply replace flw with vsn if you so desire:

But you better be able to explain the negative flow.

1-Visitor
May 11, 2016

I think i managed to make it as i would like it to be.

In the assignment that I am doing, I am supposed to point out excactly where one of pumps will not deliver any flow to the system. In Freds example I can not point out that point because it does not hit 4.5 bar, as it is supposed to if i had made the curve by hand.

If you take a look at the curve that I have made know you can see the difference.

25-Diamond I
May 11, 2016

I think I see what you mean.

In Freds sheet vsn hits zero at 4.623 bar.

If you chose a fourth order polynomial instead of Freds second order, the hit is at 4.548 bar. Would this 0.05 bar  really be noticeable in a plot? After all, a regression is an approximation anyway (as is a hand drawing). And you don't gain more precision with what you do.

BTW, you dont have to deal with > and = in two different branches. You can use

or even shorter with the if-function (similar to Excel and similar unclear to read as well)

WE

1-Visitor
May 11, 2016

succes.png

1-Visitor
May 11, 2016

Thanks a lot

This not a question for this task, but could I by programming leave out a part of a curve by programming for example all values below 4.5 bar and values above 5. bar

Can I type in anything that says not possible?

hh.png

25-Diamond I
May 11, 2016

Sure you can. You may also combine two constraints with the AND operator rather than using "also if".

If you return a text like "not possible" for illegal arguments you may run into problems whith calculations using your functioon (you can't do math with text) but you may return 0 or NaN (Not-a-Number) instead.

1-Visitor
May 11, 2016

I have tried doing it like this, but I'm not getting the result that I would like to.

I've made to lines in paint, and i would like to leave out everything that is not between these to lines, and I thought I nailed it, but I didn't.

curve.png

25-Diamond I
May 11, 2016

What did you expect to see?

You function HM never ever returns a value which could be plotted.

You have to say which value should be returned if pp is in the range from 1.5 to 3 bar!

Probably using soemthing like "else HM(pp)" at the end.

Even better would be

if 1.5 bar <= pp <= 3 bar

     HM(pp)

else

     NaN

1-Visitor
May 12, 2016

Off course! I guess I have misunderstood the programming a little. Thank you very much.

Do you know if books or sites besides this side that could improve my MathCad skills?