Solved
Scaling
- 11 replies
- 3736 views
- Translate All
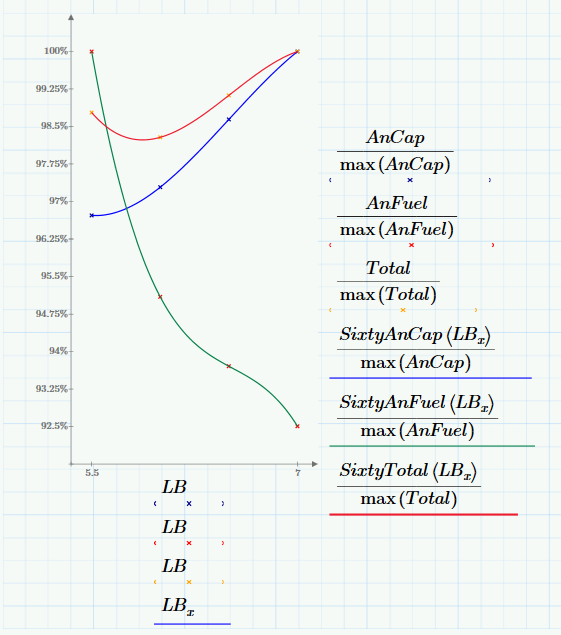
I am doing some cost analysis in the attached sheet. I want to show visually the shapes of the three curves which if I plot each separately is easy to do. However, because the scales are so different I am struggling to find a way to show the shapes of the curves visually on one plot as they appear as straight lines when plotted together. Any tips?
Andy