1-Visitor
February 15, 2016
Solved

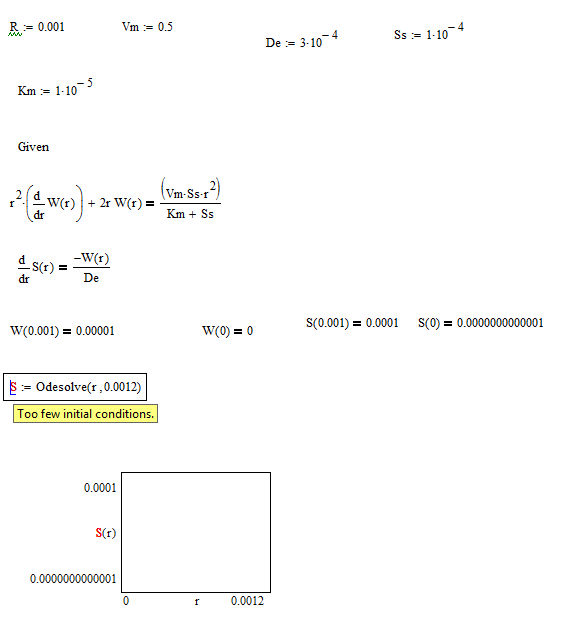
seeking for help: too few initial conditions for differential equations in mathcad

  • February 15, 2016
  • 5 replies
  • 3182 views

Hi,

I want to solve trwo consecutive differential equations in Mathcad 15, which is like following picture,
QQ图片20160215123848.png

Actually, I want to get the plot of S(r) with r. In addition, "r" ranges from 0 to 0.001. I don't know how to deal with my error, hope to get your help.

Please, kindly find the attachment about this task. Thank you very much.

Jason

Best answer by Werner_E

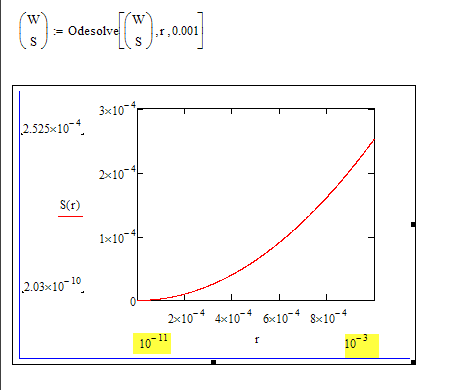
Mathcad's Quickplot isn't perfect.

Either use a range variable for r

or at least set the start and end point for the plot manually:

5 replies

23-Emerald IV
February 15, 2016

I'd say rather than too few initial conditions, you have too many (namely 4 instead of 2).

First of all let's establish that you have a single differential equation for the function W(r). That is because S(r) is NOT involved in the first equation.

The second equation tells that W(r) is the derivative of S(r) multiplied with a constant.

So you only have to solve the first differential equation to find W(r) and then S(r) can be found by integrating.

You might indeed say they're consecutive: one follows the other. They're not simultaneous!

Let's do some work:

I would guess that this solution implicitly assumes that  W(0)=0 and S(0)=0, which is pretty close to two of the initial conditions you've provided.

You say that r ranges from 0 to 0.001. Well here's the plot:

Does this meet your expectations?


Luc

19-Tanzanite
February 15, 2016

Or, avoiding all the symbolic math,

25-Diamond I
February 16, 2016

Here is a third approach, following more closely what you had tried to do:

1) You have two functions W and S - so you have to solve for both, not just for S

2) You had a typo in the last W(r). You had a multiplication W*(r)

3) You cannot chose r=0 as start value -> division by zero (first equation, if solved for the derivation of W).

4) Its was already said: you had too much initial conditions for a system of just two DE's of 1st order

Regards, Werner

zjiang1-VisitorAuthor
1-Visitor
February 16, 2016

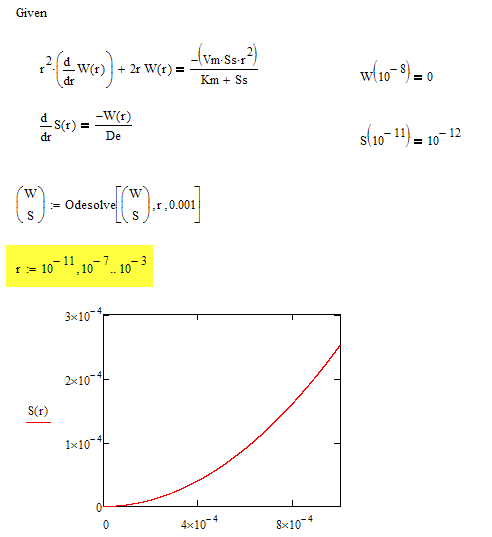
Thank you for your detail solution. It's very useful for me. And, I 'm sorry I give the wrong first equation, the right equation is as following:

1.png

As you can see from the above picture, I still can't get the plot. I don't know why?

In addition, I have know the condition from question, S(0.001)=0.0001, which is not matched with your plot. Could you help me figure out what's wrong?


Please kindly find the attachment.


Best wishes,

Jason

Werner_E25-Diamond IAnswer
25-Diamond I
February 16, 2016

Mathcad's Quickplot isn't perfect.

Either use a range variable for r

or at least set the start and end point for the plot manually: