15-Moonstone
Dec 27, 2022 3:46 PM UTC
Solved

Sici spiral, create graphic

Between Christmas and New Year's I want to "play" with curves on graphs in Mathcad 14. I am particularly interested in the graphical representation of the Sici spiral (or named after Nielsen). It is represented parameterized in the Cartesian x-y coordinate system by x=Si(t) and y=Ci(t) with t>0. The Si and Ci functions are found in Mathcad on the f(x) menu. But they don't work in the diagram, even though I followed the instructions from the "Help". That's why I didn't attach a test file here. What am I doing wrong?

Kind regards, Alfred Flasshaar

Werner_E
Werner_EAnswer
25-Diamond I
Dec 27, 2022 5:13 PM UTC

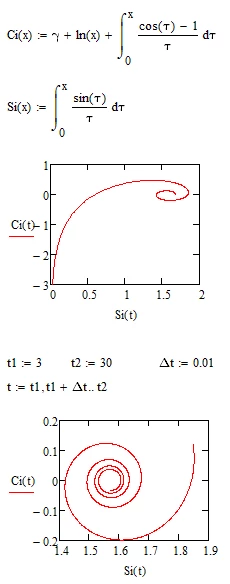
Of course you can redefine the function and evaluate the necessary integrals numerically that way:

Werner_E_3-1672161514856.png


14 replies

Werner_E
25-Diamond I
Dec 27, 2022 5:10 PM UTC

As the help states, Si() and Ci() are symbolic only functions. They cannot be evaluated numerically and plotting requires numeric evaluation.

Werner_E_0-1672161020791.png


Translate
Werner_E
Werner_E25-Diamond IAnswer
25-Diamond I
Dec 27, 2022 5:13 PM UTC

Of course you can redefine the function and evaluate the necessary integrals numerically that way:

Werner_E_3-1672161514856.png


Translate
15-Moonstone
Dec 27, 2022 5:56 PM UTC

thank you very much 🙂

Translate