12-Amethyst
October 5, 2022
Solved

Sum of value above

  • October 5, 2022
  • 1 reply
  • 1224 views

Hello, I am trying to create a value for the sum above to then plot in an overall graph of capacity vs increments.so capacity vs Ts.idx (100mm) increments. 


Increment

Ts.idx 0 would be 0 

Ts.idx 0.1 would be 0.08+0=0.08

Ts.idx 0.2 would be 0.321+0.08+0=0.401 

etc and so on.


so, the value of Ts.idx and everything above it


Then I can see quiet easily and what total length would be needed to resist the ULS load in a good visual output. 

 

Best answer by Werner_E

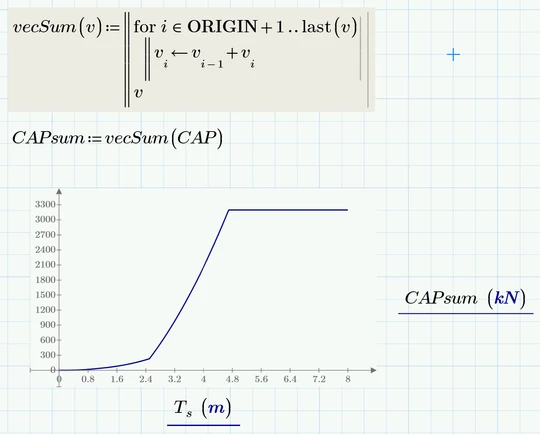
Are you looking for something like this?

Werner_E_1-1664985645905.png


You could do without the utility function vecSum

Werner_E_2-1664985793822.png
but I won't recommend it.


1 reply

Werner_E25-Diamond IAnswer
25-Diamond I
October 5, 2022

Are you looking for something like this?

Werner_E_1-1664985645905.png


You could do without the utility function vecSum

Werner_E_2-1664985793822.png
but I won't recommend it.


12-Amethyst
October 5, 2022

Yes, thank you Werner_E very helpful