
Solved
surface plot
- November 25, 2014
- 1 reply
- 3999 views
Hello,
Could you please help me with the attached graph? The surface graph shows much higher values for the parameter on z-axis.
Thank you.

The problem is that you want to plot a surface but you don't have surface data!
All you have is a bunch of more than thousend points in 3D. You can plot those points chosing scatter plot and maybe connect the points in the order the points are in the vectors you provide. But you dont have a mesh structure which would enable mathcad to plot a surface through those points.
I don't know why Mathcad does not return an error message when you try to do a surface plot with simple point data but it doesn't. Instead it tries to create a surface by some sort of interpolation. i have no idea what it tries and how, but this seems to be the reason for the high z-values you noticed.
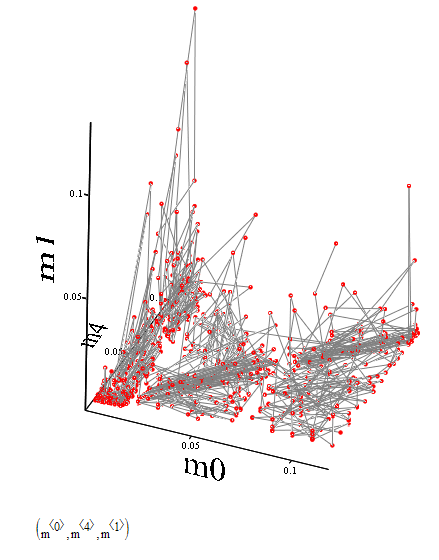
using a scatter plot will give you the correct z-values, but no surface.
Unfortunately Mathcad does not provide any 3D surface fitting or regression methods, so unless you are able to rearrange your data to form a mesh you will have to program that kind of routines on your own.
You also search this forum for buzzwords like "surface fit" - maybe someone had already posted a routine you could use.
Here is what the scatter plot of your data looks like:
Enter your E-mail address. We'll send you an e-mail with instructions to reset your password.