Trendline, Curve fitting, Regression in Mathcad, Extracting values from plots or from results of functions with range variables
Sorry if this question might seem trivial or a repetition but here is my question:
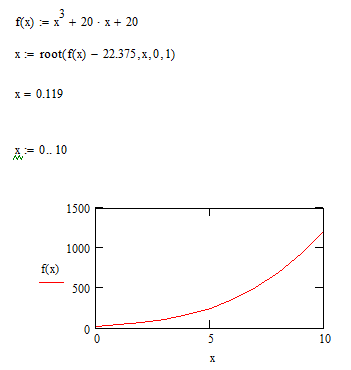
I will use a simple function to explain my problem - If I have a function say f(x) = x^3+20x+20. And x is a range variable e.g x=2,4,6....20. If I plot in Mathcad the function f(x) vs x, I get a polynomial curve. Now, If I say, f(x) = 22.375 is a fixed limiting value for which I want to know the value of x at this limiting value of f(x), how do I tell Mathcad to give me this value of x for which f(x)=22.375. Is there a program or Mathcad function that I can write for Mathcad to solve this for me.
I have given a very simple function to explain my problem but the function which I am dealing with is much more complex. In order to add depth to my question, you can imagine the function I am dealing with as the stress on a machine component that depends on displacements of the component. At the start of my Mathcad worksheet, I define the displacement as a range variable, e.g. x=0,1,2...9. Then through a series of many equations, I get a final equation of stress as a function of x-displacement. So the results of the stress will be an array of equal length as the defined range variable for the x-displacement. E.g. If my x-displacement was defined as x=0,1,2...9, that gives me 10 values.. So the stress result will have 10 values corresponding to the displacements 0,1,2...9. Let us say that the stress values range from 50 to 1000. However, I have a limiting stress of 550. With this limiting stress value, I can define the maximum displacement which the machine component can withstand. But this exact value (550) is not in the stress result output that Mathcad has produced. So I cannot say definitely which displacement corresponds to this limiting stress value. I can say the range in which it lies but can't say exactly its value. How can I solve this in Mathcad?
In Excel, I will plot my stress results obtained against the displacement values defined. Then I will obtain a trendline equation. Then I will use the trendline equation to get the value of x for a fixed value of f(x). The problem however is that, if the trendline equation is a polynomial, then I get multiple values of x and have to figure out based on the range I already know, which value of x is the one I want.
But, please, how can I handle this problem in Mathcad, if there is a possibility at all