Solved
Why wont it graph?
- 9 replies
- 5268 views
- Translate All
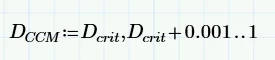
I have a piecewise non-period behavior that I'm trying to express by using two intervals but all I get is a blue dot for the second trace if the spacing its space is defined to be other than the default value of "1". Do I have to use logic statements to graph piecewise if I don't want a spacing of "1" between points to graph on my blue trace?
It seems I'm strictly limited to the array in purple for subsequent plot lines after the first? I guess that's O.K. for plots with a magnitudinous domain but I only want to plot up to "1" so it is a bit inconvenient.
Thanks in advance for your guidance...