1-Visitor
August 16, 2014
Solved

x,y,& z parametric equations and 3-d plot

  • August 16, 2014
  • 1 reply
  • 4835 views

Greetings,

I am trying to build a mobius strip in Prime 2.0

I have, what I believe, the equations in x, y, & z defined (found at Wolfram Mathworld), along with the other variable required.

The trouble is plotting the equations.

Attached is the file with what I have so far.

Any clues as to how to build the surface would be appreciated.

TIA,

P. Quint
Best answer by Werner_E

Prime's 3D-plot capabilities are very limited.

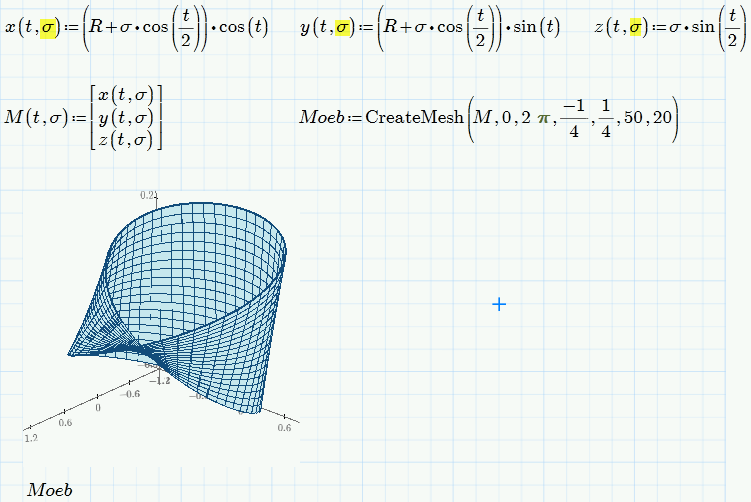
You may try an approach using "CreateMesh":

1.png

You might be interested in these links, too:

http://mpasternak.wel.wat.edu.pl/RekreacjeM/mobius.pdf

http://college.cengage.com/mathematics/larson/calculus_analytic/7e/instructors/downloads/lab19mcd.pdf

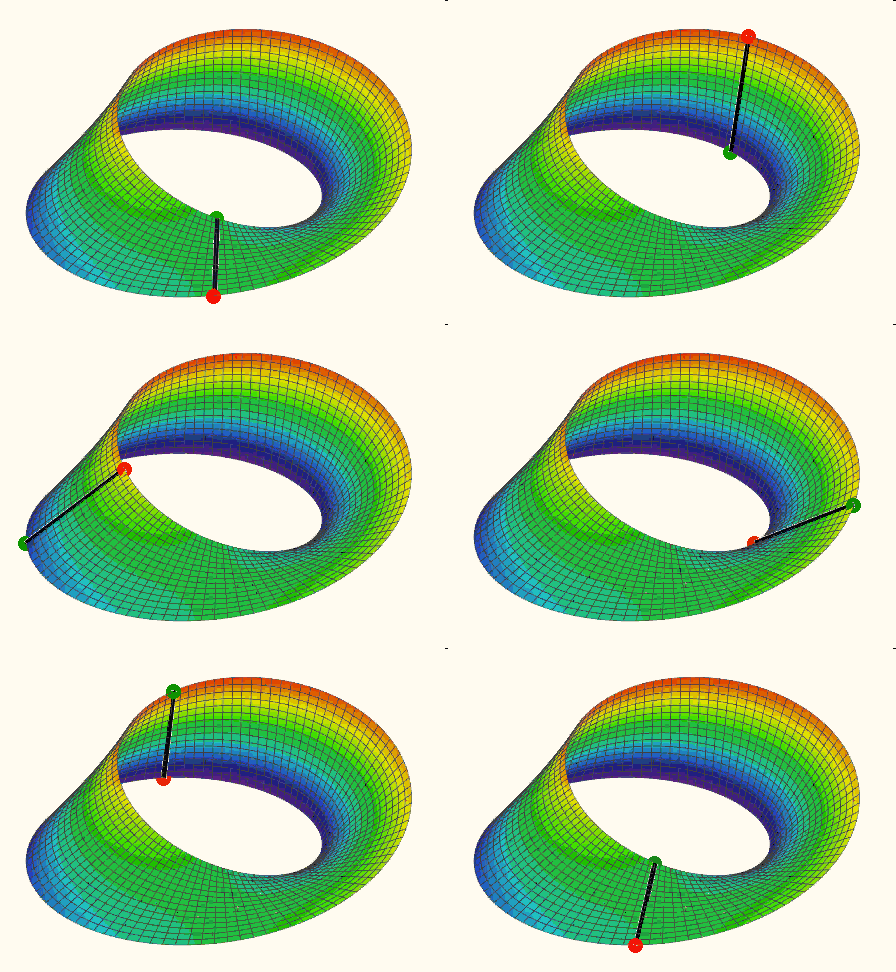
Click the picture below to see the animation (made with Mathcad 15):

moebius.gif

1 reply

Werner_E25-Diamond IAnswer
25-Diamond I
August 16, 2014

Prime's 3D-plot capabilities are very limited.

You may try an approach using "CreateMesh":

1.png

You might be interested in these links, too:

http://mpasternak.wel.wat.edu.pl/RekreacjeM/mobius.pdf

http://college.cengage.com/mathematics/larson/calculus_analytic/7e/instructors/downloads/lab19mcd.pdf

Click the picture below to see the animation (made with Mathcad 15):

moebius.gif

pquint1-VisitorAuthor
1-Visitor
August 17, 2014

Thanks Mr. Exinger!

From http://mpasternak.wel.wat.edu.pl/RekreacjeM/mobius.pdf and your pic, I can see why; the x,y, & z equations contain two variables.

But, in the formar, the relationship between w & v is not defined.

I'm going to assume that the sigma is the same as defind in my worksheet.

I'll give it a go and let you know,

PLQ

25-Diamond I
August 19, 2014

Peter Quint wrote:

Thanks Mr. Exinger!

From http://mpasternak.wel.wat.edu.pl/RekreacjeM/mobius.pdf and your pic, I can see why; the x,y, & z equations contain two variables.

But, in the formar, the relationship between w & v is not defined.

I'm going to assume that the sigma is the same as defind in my worksheet.

In that sheet w seems not to be used at all.

The function argument you called sigma is called v in that sheet.

Imagine a vertical line segment which is rotated about the z-axis. The surfaced covered is part of a clinder. Now we additionally rotate that line segment around its midpoint (in a plane which includes the z-axis) so, that when the midpoint has described a full 360° circle, the segment has turned by 180° (half speed, thats where the t/2 is coming from. Now we get the Möbius surface. The midpoint has to travel two times around for all to be in the initial position (see the animation in my last post and watch the red and green end points of the moving line segment).

The variable a in the linked sheet controls that second rotation of the segment. If you chose lower values than 2, you get more twists of the band.

BTW, if you wonder why the plot in Prime doesn't look like the animation and other pics you usually find. Thats because of the scaling. In Mathad 15 I had chosen "equal scale". This is one of the many fearures not available in Prime. So you will have to scale all three axis individually to the same scale to get a similar effect.