1-Visitor
May 3, 2017
Solved

XY Scatter

  • May 3, 2017
  • 7 replies
  • 2442 views

I a trying to get to grips with the graphing capability of Mathcad.

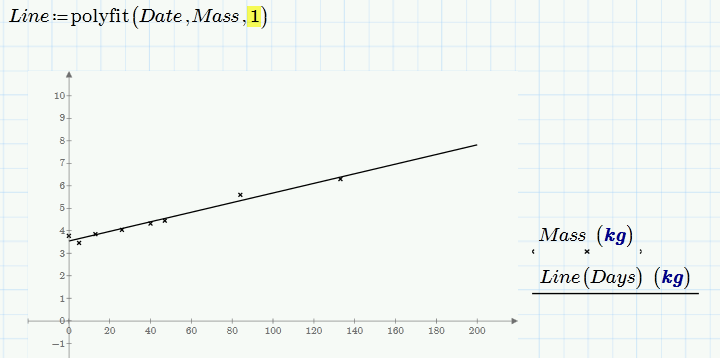
In the attached I have used a polyfit which obviously is not what I want (I am not sure how to use other graphing functions).

How can I get a line of best fit approach?

Best answer by Werner_E

Ah! I have not read the text thoroughly enough and did not read that a regression line is searched for.

You can also use "polyfit" for that case:

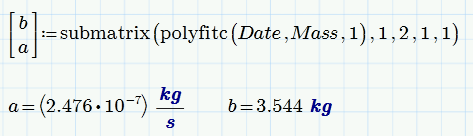
And in case you need the coefficients, you may use "polfitc":

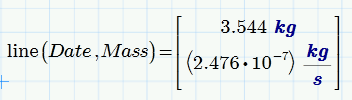
or the built-in "line" command:

7 replies

awibroe1-VisitorAuthor
1-Visitor
May 3, 2017
23-Emerald IV
May 3, 2017

Instead of:

Try these:

Then:

Success!

Luc

Werner_E25-Diamond IAnswer
25-Diamond I
May 3, 2017

Ah! I have not read the text thoroughly enough and did not read that a regression line is searched for.

You can also use "polyfit" for that case:

And in case you need the coefficients, you may use "polfitc":

or the built-in "line" command: