Hi @anaclos
The PTC.SCA.SCO.DygraphUtils thing contains a service that helps generate data in the correct format for the JSONData property on the widget. The GenerateDygraphData service provides history data for a specified list of properties, either from the value stream for a thing, or from the database, in a format for the Dygraph widget to display.
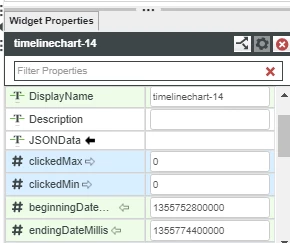
JSONData—The data used in the chart is a JSON, sent in string format. A string is used to send the information, rather than an infotable, because infotables are passed to the widget line by line, requiring further manipulation of the data for it to be fed to the chart. Using a string allows the data to be sent all at once to the Dygraph library to render the chart. The format for this JSON is CSV. You can either use the GenerateDygraphData service of PTC.SCA.SCO.DygraphUtils thing or a service that calls GenerateDygraphData, to convert an infotable to CSV. Given a valid set of input, this service returns data in CSV format that can be bound to the JSONData property in the widget.
If you donot provide labels , the JSONData can provide the data label.
Another helpful link could be
Thanks
Gunjan Aneja