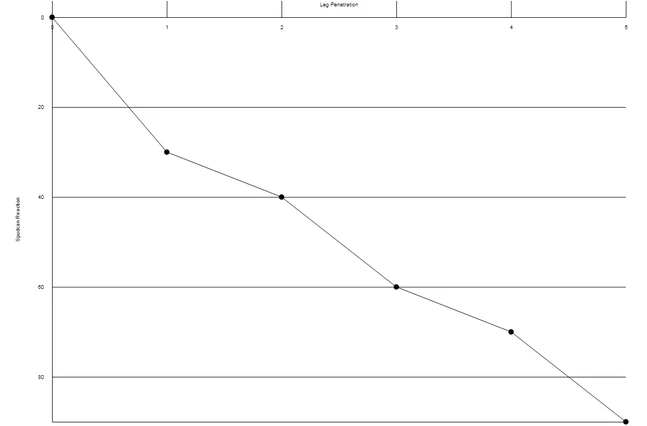
Hi @PEHOWE, thanks for the reply. To answer your questions:
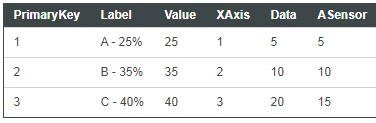
- Did you have a version which displayed the graph? Apologies, I have attached another zip file for the widget which displays the graph. You will have to create an infotable with 2 values and bind them to the widget on your side using GetProperties.
- Did this version have hard coded values? The hard coded values are in the drawChart function in the runtime.js file. (var data = [{x: 0, y: 0}, {x: 10, y: 20}, {x: 20, y: 40}, {x: 30, y: 60}, {x: 40, y: 80}];)
- Where you able to send an info table into the function and get the data to display? I was not able to send an infotable into the function and get data to display despite binding the infotable to the widget.
- Was the issue with getting the grid to update after new data was added? As I cannot even get data to display without using hard-coded values, the chart cannot be updated after new data was added.
EDIT 1: I used the debugger in developer tools and found the following errors.
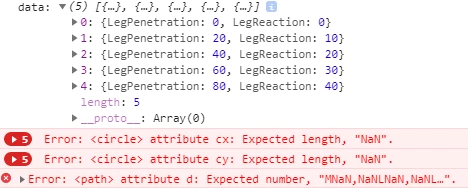
It seems like the data from the infotable is passed into the drawChart function correctly but there is some error in the drawing of circle and line path. The relevant code is as shown.
// interpolator for X axis -- inner plot region
var x = d3.scaleLinear()
.domain([ d3.min(data, function(d){ return d.LegReaction; }),
d3.max(data, function (d){ return d.LegReaction; }) ])
.range([0,innerWidth])
.nice();

// interpolator for Y axis -- inner plot region
var y = d3.scaleLinear()
.domain([ d3.min(data, function(d){ return d.LegPenetration; }),
d3.max(data, function (d){ return d.LegPenetration; }) ])
.range([0,innerHeight])
.nice();

// plot a circle at each data location
 g.selectAll(".dot")
 .data(data)
 .enter().append("circle")
 .attr("class", "dot")
 	 .attr("cx", function(d) { return x(d.x); } ) //should be d.LegReaction
 	 .attr("cy", function(d) { return y(d.y); } ) //should be d.LegPenetration
 	 .attr("r", 5);

//the line function for path
 var lineFunction = d3.line()
 .x(function(d) {return x(d.x); }) //should be d.LegReaction
 .y(function(d) {return y(d.y); }) //should be d.LegPenetration
 .curve(d3.curveLinear);

 //plot line
 var path = g.append("path")
 .attr("d", lineFunction(data))
 .attr("stroke", "blue")
 .attr("stroke-width", 2)
 .attr("fill", "none");
EDIT 2: I was able to figure out the error and added comments to the code above to show where I went wrong.