1-Visitor
October 18, 2019
Solved

How to bind data on infotable

  • October 18, 2019
  • 6 replies
  • 3183 views

Hi all,


I am beginner to use chart and I am having difficult to create data to it.


I get data from my PLC through of Industrial Connectivity.


To start my experience I am following this guide. 

https://developer.thingworx.com/en/resources/guides/display-data-charts/ddc-introduction


I have ever created a value stream, data shape and thing like the example showed.


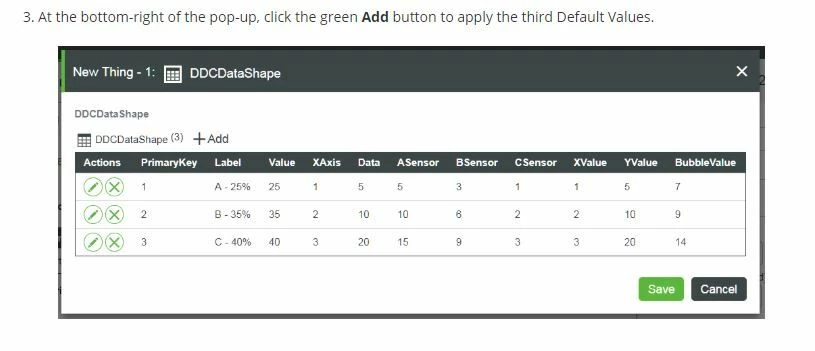
But in the guide the information into the infotable are put manually. Image below.


Capturar.JPG

I have a thing with my data from PLC but I do not able to insert this data into of infotable. Is there any way to do it?


Regards,

Leonardo


Best answer by Constantine

Leonardo,


Your last screenshot explains why you don't get any values.


You need to mark some of those properties as Logged (edit property and select "Logged" checkbox), then their values will be saved in the Value Stream each time they change. After that you will be able to get the list of historical values via one of the Query...PropertyHistory services (there are few of them, quite self-explanatory). This way you won't need to create your own Infotables and will just call some of those services directly from your mashup, binding their results to your grids and charts. 


Of course, if you want to do some calculations based on those historical values before displaying them in your mashup (calculate some averages, enrich your data with some external values, etc.) then you'll need to create a service, which will still call some of those Query...History, and then work on the returned data and then return it as another Infotable. But as the first step I would recommend you to do this simple and straightforward sequence with executing Query...History service directly from your mashup. I hope it makes sense in your case.


More details (with useful links!) about Value Streams are in ThingWorx Help: http://support.ptc.com/help/thingworx_hc/thingworx_8_hc/en/#page/ThingWorx%2FHelp%2FComposer%2FDataStorage%2FValueStreams%2FValueStreams.html


/ Constantine

6 replies

18-Opal
October 18, 2019

Hello Leonardo,


Do you see the history of your values when you execute service QueryPropertyHistory on the thing that receives data from PLC, to which you bound your ValueStream?


Regards,
Constantine

einsfele1-VisitorAuthor
1-Visitor
October 18, 2019

Hi @Constantine 


I did not receive any data when I execute this service


nodata.JPG


Follow image of my config thing


general.JPGthing.JPG

18-Opal
October 18, 2019

Leonardo,


Your last screenshot explains why you don't get any values.


You need to mark some of those properties as Logged (edit property and select "Logged" checkbox), then their values will be saved in the Value Stream each time they change. After that you will be able to get the list of historical values via one of the Query...PropertyHistory services (there are few of them, quite self-explanatory). This way you won't need to create your own Infotables and will just call some of those services directly from your mashup, binding their results to your grids and charts. 


Of course, if you want to do some calculations based on those historical values before displaying them in your mashup (calculate some averages, enrich your data with some external values, etc.) then you'll need to create a service, which will still call some of those Query...History, and then work on the returned data and then return it as another Infotable. But as the first step I would recommend you to do this simple and straightforward sequence with executing Query...History service directly from your mashup. I hope it makes sense in your case.


More details (with useful links!) about Value Streams are in ThingWorx Help: http://support.ptc.com/help/thingworx_hc/thingworx_8_hc/en/#page/ThingWorx%2FHelp%2FComposer%2FDataStorage%2FValueStreams%2FValueStreams.html


/ Constantine