

How to display data from infotable on custom XY chart widget
Hi all, I am trying to display data from my infotable on a custom XY chart widget that I've made. However, no data is displayed on the XY chart and I don't know where I'm going wrong.
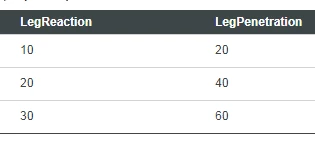 Infotable showing x and y values
this.updateProperty = function (updatePropertyInfo) {
 if (updatePropertyInfo.TargetProperty.indexOf('Data') === 0) {
 	var dataRows = updatePropertyInfo.ActualDataRows;
		TW.log.info('Datarow: ' + dataRows);
	 	if (updatePropertyInfo.TargetProperty === 'Data') {
		 this.setProperty('Data', updatePropertyInfo.RawDataFromInvoke);
		 this.drawChart(dataRows);
 }
 }
}
this.drawChart = function (rowData) {
		var widgetProperties = this.properties;
 if (rowData != undefined && rowData != "") {
		 var data = rowData;
 }
 /* chart drawing code happens here*/
 TW.log.info('Data: ' + data);
}
 console log
So what I'm doing here is getting the data from the ActualDataRows, setting the data by using updatePropertyInfo.RawDataFromInvoke and passing it into the drawChart function. The chart is drawn as per normal but the data points are not plotted on my chart as expected. The console log shows that my data is passed correctly to the drawChart function as 3 pairs are passed (3 data rows in my infotable) but apparently all three pairs are [0,0], [0,0] and [0,0] as I only see [0,0] plotted on my XY chart. I have attached the zip file if anyone wants to try it out for themselves. Any help is greatly appreciated!