
1-Visitor
August 27, 2019
Solved

Negative displaying in the Pie Chart

  • August 27, 2019
  • 2 replies
  • 997 views

Hello!


I have an infotable with the following data:

 

9.PNG


When displaying this data in the Pie Chart the second and third records are displayed in different colors:
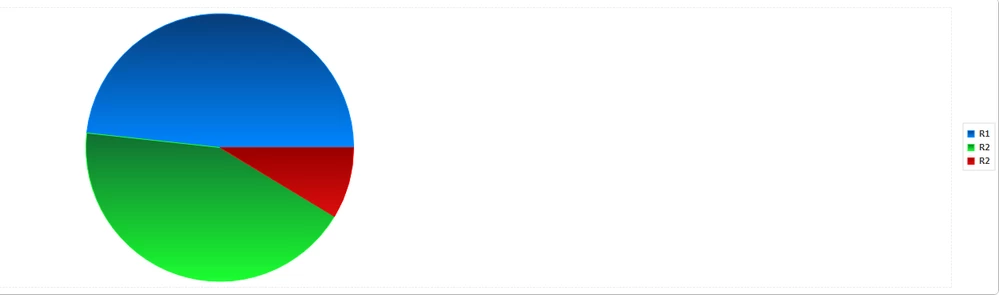
10.PNG


Can this widget combine records with the same Label-field and color them in one color so that there are no such repetitions?

Best answer by Constantine

Hello,


I'm not sure about the widget, but in case it isn't possible, you can easily group it on the server side:

var result = Resources["InfoTableFunctions"].RenameField({
 t: Resources["InfoTableFunctions"].Aggregate({
 t: infotable,
 columns: "col2",
 aggregates: "SUM",
 groupByColumns: "col1"
 }), 
 from: 'SUM_col2',
 to: 'col2'
});

(Substitute infotable, col1 and col2 with correct names).


Regards,
Constantine

2 replies

18-Opal
August 27, 2019

Hello,


I'm not sure about the widget, but in case it isn't possible, you can easily group it on the server side:

var result = Resources["InfoTableFunctions"].RenameField({
 t: Resources["InfoTableFunctions"].Aggregate({
 t: infotable,
 columns: "col2",
 aggregates: "SUM",
 groupByColumns: "col1"
 }), 
 from: 'SUM_col2',
 to: 'col2'
});

(Substitute infotable, col1 and col2 with correct names).


Regards,
Constantine

1-Visitor
August 28, 2019

Thanks!