

Obtain same behavior as QueryNamedPropertyHistory for Time Series Chart in a custom service
Hello community,
I am trying to display multiple charts onto the Time Series Chart widget. The number of displayed chart is dynamic and based on user selection within a list widget.
I can obtain the desired behavior by using the QueryNamedPropertyHistory service.
Now, here is my issue. We had to change the architecture of the shapes/templates.
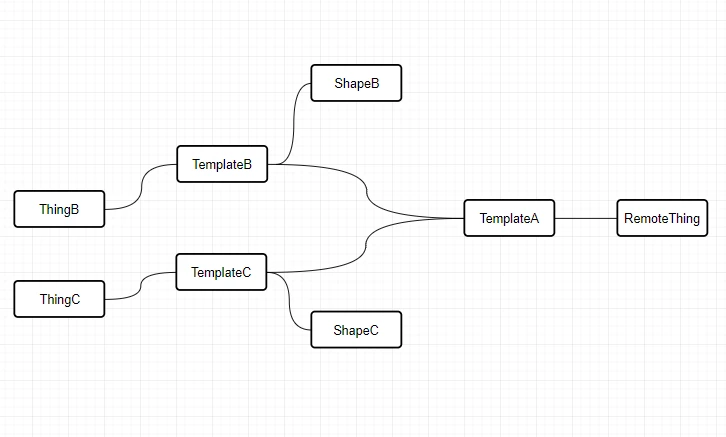
The list can now display properties from shape B or C. It is only defined at "runtime" (based on user selection on another list).
Which means I have to call dynamic QueryNamedPropertyHistory on TemplateA level. But this doesn't work with Time Series Chart widget like it would when I would called it directly "at the shape level containing the properties".
I tried wrapping the service within a custom service which output an untyped Infotable.
The service itself work (it returns an infotable with a datashape [timestamps/ prop0 / prop1] which varies based on property names. But it the column are not automatically mapped onto the chart widget.
I tried using the QueryImplementingThingsWithNamedPropertyHistory too.
I tried other type of time series chart widget too.
Now here are my questions :
1) Is there a way to achieve the behavior I want with the data model I presented? (Using multiple chart widget and a contained mashup is not a good "scalable" option for me because the number of template will change)
2) What happens exactly when we use QueryNamedPropertyHistory? Because the function itself doesn't have a "fix" output type. Yet, within the mashup definition page we have access to the returned data. It's like the datashape is defined internally, which might explain why it works with the chart widget. Is there a way to reproduce this?
Thank you for your help!
Eric