1-Visitor
April 24, 2016
Question

problem with time series chart

  • April 24, 2016
  • 2 replies
  • 4361 views

Hi all,

i read in this forum that time series chart can find the first date time column and put it as the x axis,

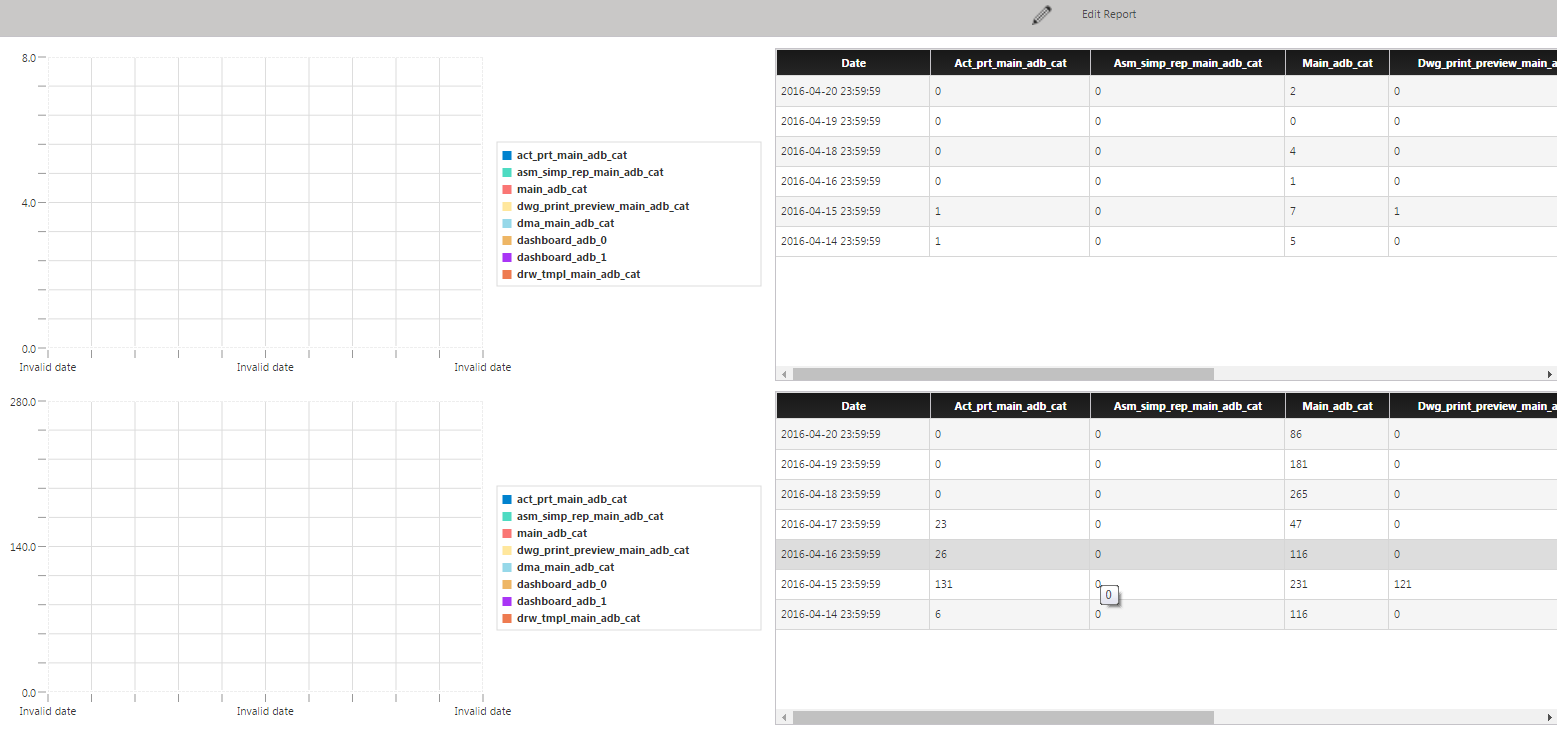
but for some reason it's doesn't do this trick for me., any ideas??

in the following example both the grid and the chart get the same inputtime series.png

    2 replies

    5-Regular Member
    April 25, 2016

    Amir, does the XAxisFormat setting on the TimeSeries Chart match the Timestamps you're providing it?

    aharari-21-VisitorAuthor
    1-Visitor
    April 26, 2016

    thanks for the answer aanjan,yes it is matched, maybe you have any other idea?

    5-Regular Member
    April 26, 2016

    It would be helpful to see a screenshot of the property settings for the chart.

    Does the chart display properly if you select all series/x-axis in properties?

    Does your chart use-case prevent doing that ahead of time?

    aharari-21-VisitorAuthor
    1-Visitor
    April 26, 2016

    thank you Mac,

    i didn't fully understand the fields you are referring to , i attached a screenshot of the time property time series printscreen.png

    5-Regular Member
    April 26, 2016

    Amir, do you have valid data bound? If you look at XAxisField, it seems to be blank. With correct data, you would get a drop down with fields like 'timestamp' that you can choose for X-axis.

    TimeSeries.png