
12-Amethyst
January 22, 2020
Solved

Resizing time series chart

  • January 22, 2020
  • 2 replies
  • 1095 views

Hey Guys,


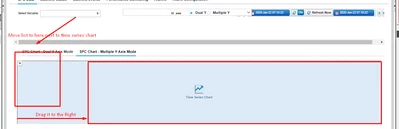
I am trying to figure out how to resize this time series chart which I believe is inside a contained mashup, but I am not sure and trying to figure out if it is.  I am new to TWX and need a bit of help.


Plan is to move the time series chart to the right to make room for the list widget which displays a drop down of items to plot against the chart. Checking the widget properties, I do not have any options to move or resize the panel / chart and looking for some advice.


\\\
 

Ecko665_0-1579696055015.png


\\\


Thanks,

Thomas, Jr.dev

Best answer by rjanardan

Cut the Time Series Chart(scissor button) and then insert a Layout widget in the area, choosing the number of columns and/or side bar(s) that you need. You can configure the percent of each column as well. Paste the chart in the desired column. 

2 replies

rjanardan16-PearlAnswer
16-Pearl
January 22, 2020

Cut the Time Series Chart(scissor button) and then insert a Layout widget in the area, choosing the number of columns and/or side bar(s) that you need. You can configure the percent of each column as well. Paste the chart in the desired column. 

Ecko66512-AmethystAuthor
12-Amethyst
January 22, 2020

Thanks for the heads up.

I'll give it go and see how I make out.


Thomas