
1-Visitor
April 28, 2018
Question

Time series chart v2 not showing data

  • April 28, 2018
  • 2 replies
  • 1492 views

Hello


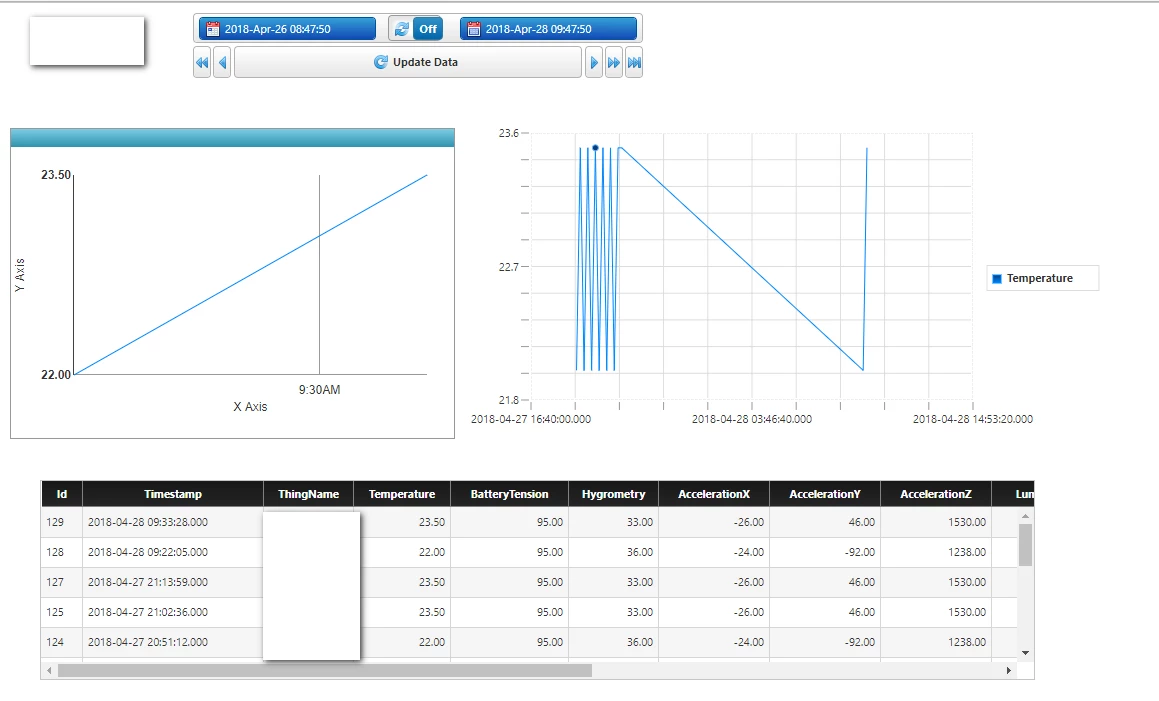
I'm displaying data from a stream using chart V2 and chart V1 with exactly le same bindings to data.

Chart V1 (embeded with THX 7.4) is working fine, chart V2 is static (as loaded with mashup) whatever I do in time picker.

The grid with same bindings is working very fine


I have an error in application log I cannot understand, I guess it is linked due to the date :

[context: com.thingworx.webservices.context.HttpExecutionContext@6ee64f5][message: Entity Not Found : [ ]]


chartV2.png

2 replies

1-Visitor
April 30, 2018

Hello pjoly,

I am also using Time series chart v2,  but i am facing some issue like 


Error

09:59:04 ERROR - TW.Runtime.Workspace.Mashups.getWidget exception loading widget { name: Error, message: timeSeriesChartV2doesn't exist }


so I want to know what is your configuration.


is it the same version as mention in below or there is some difference.

Tomcat version: Tomcat 8.5

Thingworx version:  ThingWorx 8.2.1-b140

google chrome version: Version 65.0.3325.181 (Official Build) (64-bit)


based on your reply might be I can find out the solution to my problem.


pjoly1-VisitorAuthor
1-Visitor
April 30, 2018

My configuration :

  • ThingWorx 7.4.9-b47
  • Tomcat 8.0.33
  • Chrome :  66.0.3359.139 (Build officiel) (64 bits)