Solved
Time series chart with check box
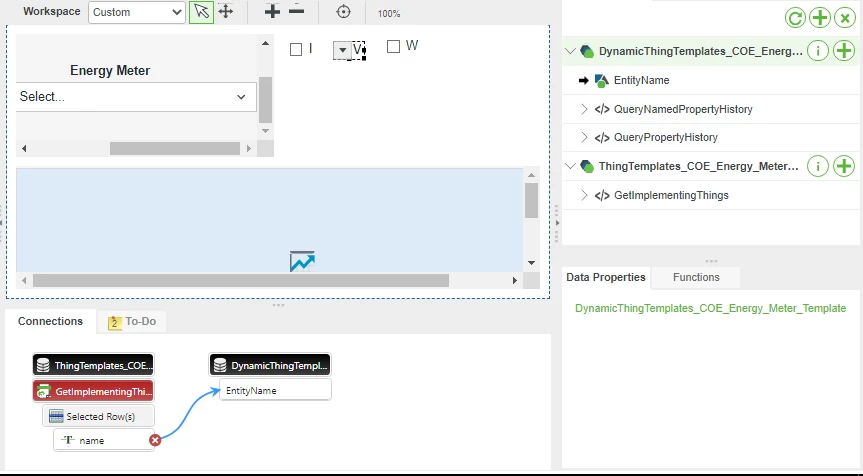
I need to display the values of current, voltage and power in time series chart based on the check box selection. How to do this?.
i) If I select Current, only Current values will be displayed in time series chart.
ii) If I select Current and Voltage, both the values should be displayed in time series chart.
iii) If I select Current, Voltage and power all the values should be displayed in time series chart.
iv) If I deselect any one it should not be displayed in the chart.
I have designed up to this and stuck after this,