

Timeseries chart XAxisMinimum & XAxisMaximum data value for Zoomed-In Graph.
I'm facing an issue in the Timeseries chart scrolling for Zoomed-in data.
Have created a Left/Right scroll button to adjust the X-axis date range to perform a scroll to left or right direction.
I have done a logic like to set the XAxisMaximum & XAxisMinimum values binding to adjust the graph X-axis range.
- Without zooming the graph scroll is working as expected.
- But the problem is when I do a Zoomed-in for a specific point set and then try to scroll left or right. The graph is not populated as expected. Because I'm unable to find an option to read the date range min/max for a zoomed-in point set.
TimeSeries Chart View
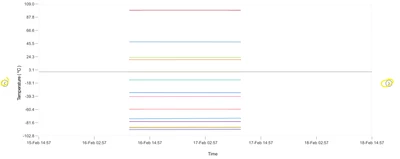
1. Above image highlighted two arrow buttons to use to perform the scrolling.
Scroll logic is working when it is in normal graph view.
2. Below image used to zooming for a specific point set.
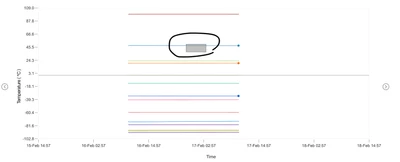
Zoomed-In View:
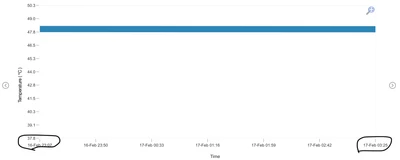
If we do the zooming for a specific point set and try to scroll the graph.
How do we read/get the start(XAxisMinimum) and end (XAxisMaximum) date value for zoomed-in. I was not able to find any properties or event to get the min/max values for zoomed-in graph.
Can anyone help me on this.