1-Visitor
March 22, 2018
Solved

Trouble binding sql query data to chart

  • March 22, 2018
  • 4 replies
  • 2779 views

Hi,

I am new to TWX and I am trying to create a simple mashup one time series chart.

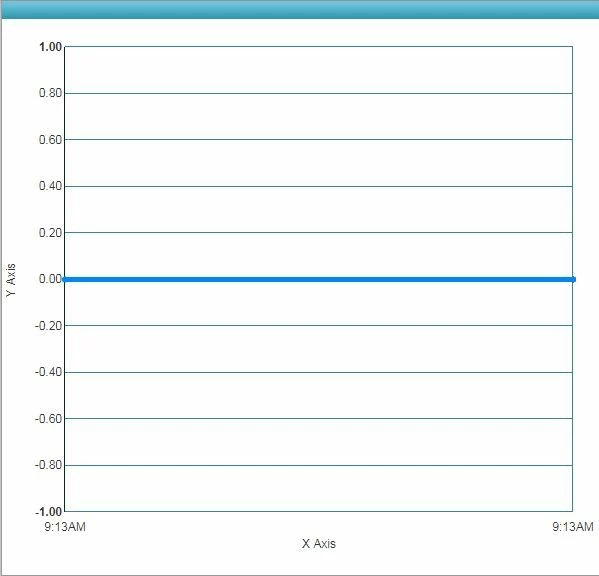
At "View mashup", I am getting a blank chart, but "Debug Info" shows that I  have several rows returned.

What am I doing wrong?


Thanks in advance.

Randy
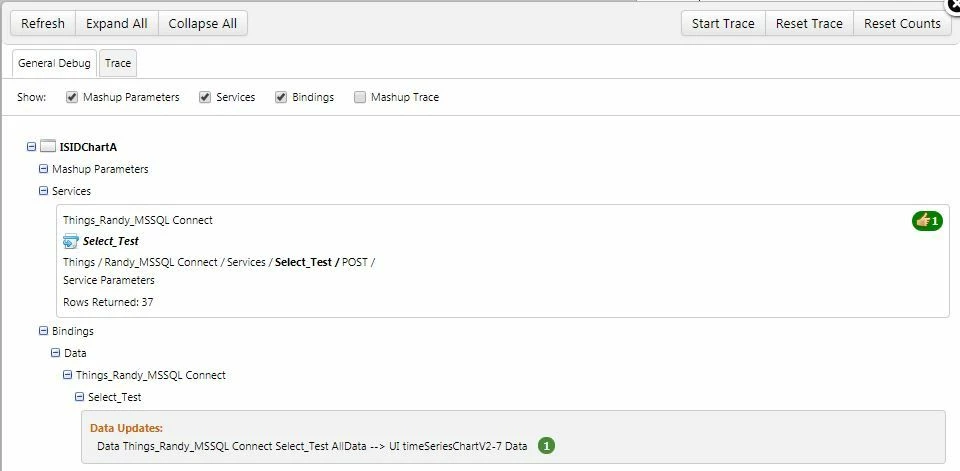
 

Debug info.JPGChart.JPG


Best answer by RandyGui

Hi Supandey


It seems that I made a mistake with data column name and it's alias name.

chart's working fine now.


Thanks again for your help.


Randy


4 replies

5-Regular Member
March 22, 2018

Hi @RandyGui may be this is an issue with the DataShape which is being used in the service's output. While it is correct that your service is working fine by returning x number of rows, however what should be checked here is that what DataShape is assigned to the output and what has been selected for the X & Y axis properties for the Time Series chart. See Time Series Chart Widget property details here

5-Regular Member
March 22, 2018
Quick mention: The link shared in my reply also contain link to the video tutorial on how to configure the chart
RandyGui1-VisitorAuthorAnswer
1-Visitor
March 27, 2018

Hi Supandey


It seems that I made a mistake with data column name and it's alias name.

chart's working fine now.


Thanks again for your help.


Randy