

Question
Why timestamp variation on x axis in time series chart by using value stream?
Dear Team,
Why timestamp variation on x axis in time series chart by using value stream? I need to show fixed inertval in time series chart
Image: 1 starting time stamp 15:10:23
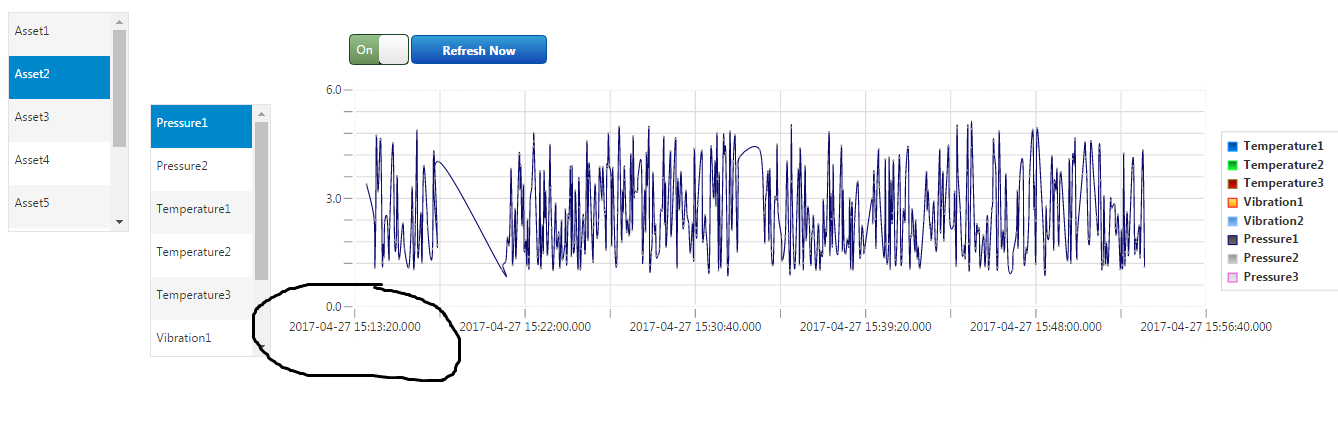
Image: 2 starting time stamp 15:13:23
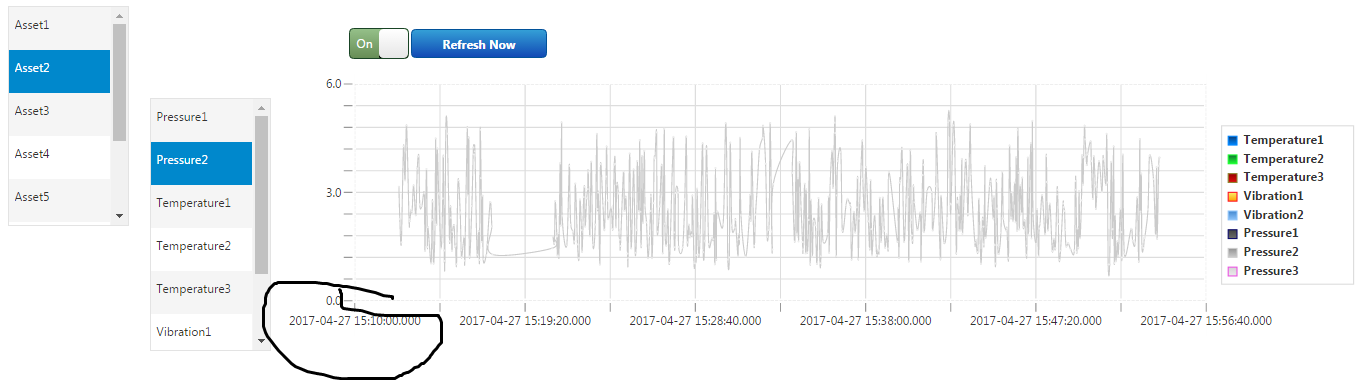
Image:3 starting time stamp 15:23:55
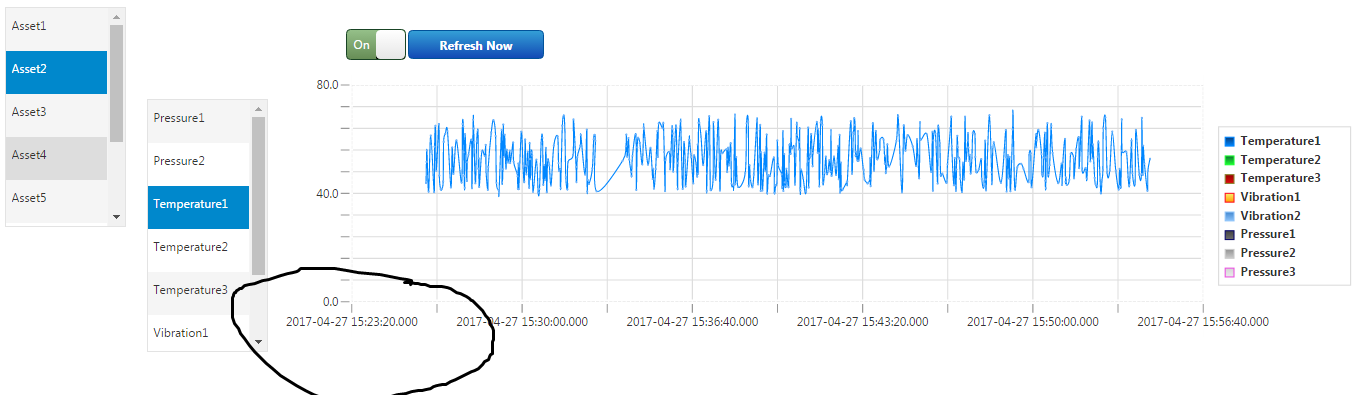
I need to show fixed start time and end time for all properties.