Question
3 parameter Weibull curves
Hello PTC Community,
I recently created a 3 parameter Weibull plot. I understand the basics of 2 paramater vs. 3 parameter and time shifting using γ (gamma).
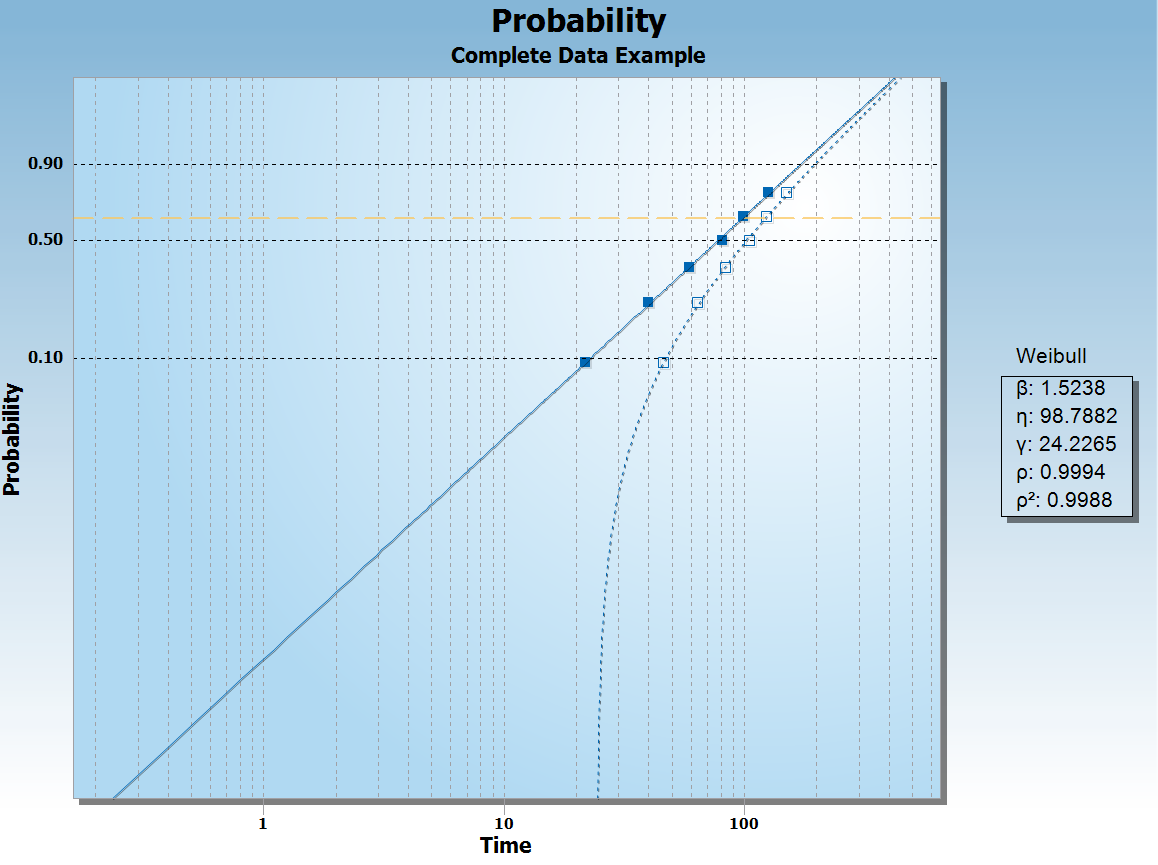
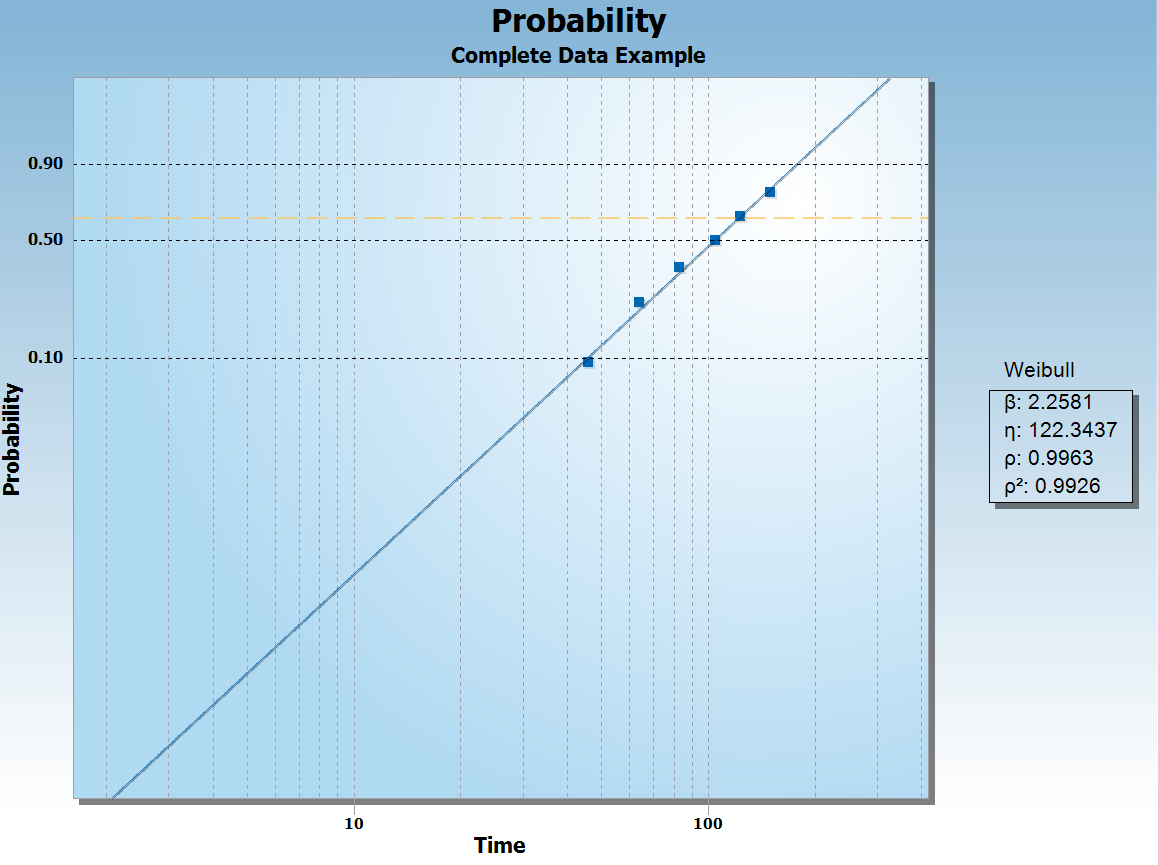
If you look at the 3-parameter Weibull plot below, the curved line is the unshifted data. My question for everyone is, what is that line? If you plot the unshifted data using 2-parameters, the line looks straight. However, when you plot it using a 3-parameters, then we see a curved unshifted line. Does anyone have any insight into this?
2-parameter Weibull plot
3-parameter Weibull plot (curved line is probability line [unshifted data], straight line is shifted data)