

How to Generate Charts In Cognos as per Date Wise
Hi All,
I'm using Cognos for generating reports. I've gnerated a report just like below..
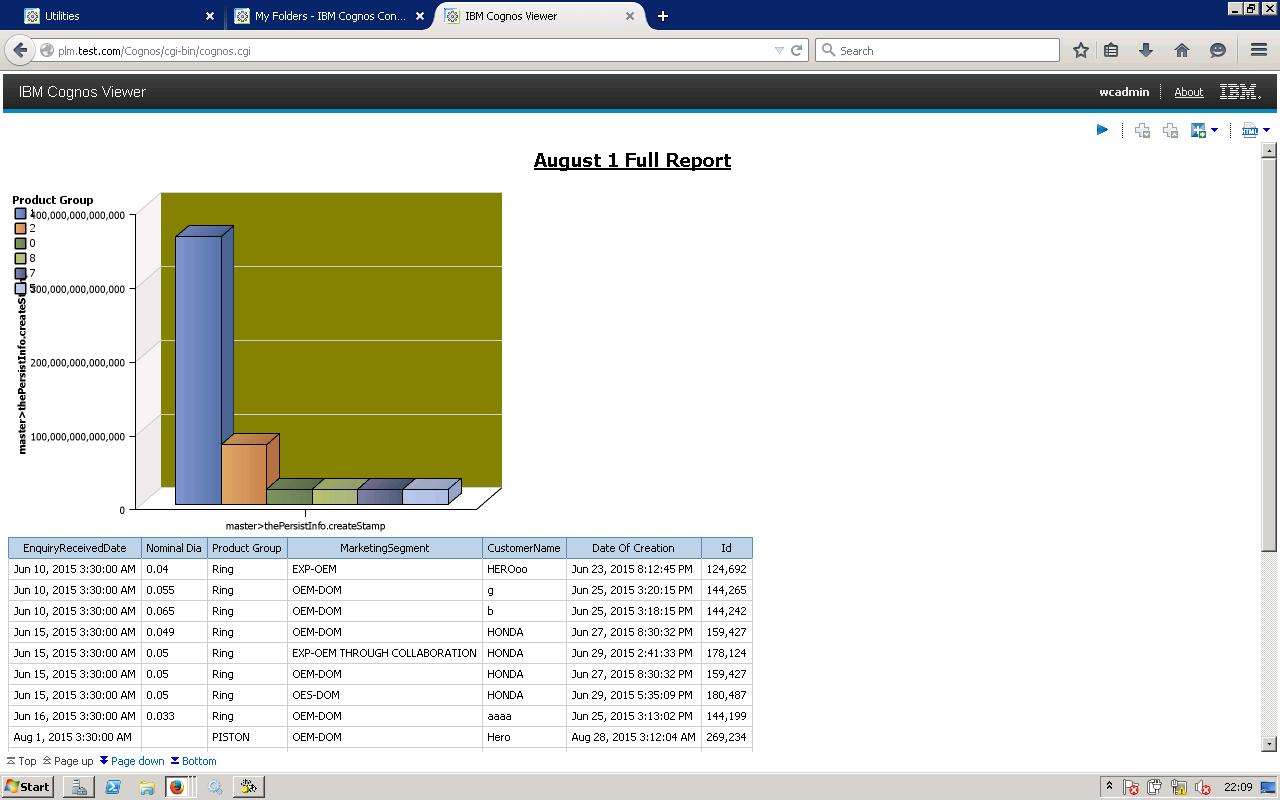
In the above chart, on X-axis there is an attribute called master.thePersistInfo.createStamp which represents the date of creation(as in above report list) picked from Windchill querybuilder. and ProdutGroup on PrimaryAxis .
But, there I need a chart such that it represents date wise(i.e Date Of Ceation from the report list in above picture) product groups. i.e on x-axis different dates have to come and also primary axis should represents ProductGroup( Like Rings, Pistons.... in above picture) list with different colours.
I'm unable to generate this chartas I'm using Cognos for the first time.
I need your help to to do so.
Kindly request to help me out.
Thanks And Regards
krishna Chaithanya